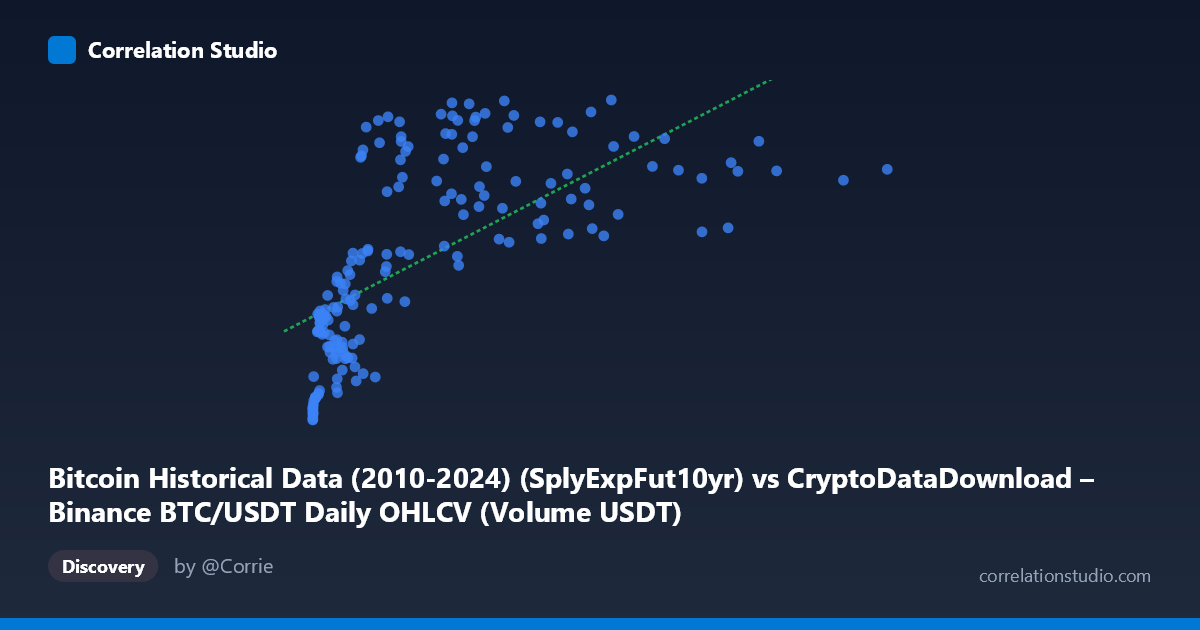
Bitcoin Historical Data (2010-2024) (SplyExpFut10yr) vs CryptoDataDownload – Binance BTC/USDT Daily OHLCV (Volume USDT)
- Pearson correlation (r)
- 0.6588
- Spearman correlation
- 0.8149
- p-value
- 0
- Sample size (n)
- 180
- 95% confidence interval
- 0.5672 to 0.7343
- Granger causality
- None
- Granger optimal lag
- 10
- Time coverage
- 2017-08-20 to 2026-02-02
AI analysis
Analysis: Bitcoin Supply-Adjusted Metric vs. Trading Volume
1. Relationship Overview
The scatterplot depicts a positive but clearly non-linear relationship between the X variable (labeled as a 10-year supply expansion futures metric, though the extreme range suggests it may actually be tracking a cumulative or compounding quantity like total volume or market cap proxy) and Y (USDT trading volume). The data shows a classic logarithmic/saturating curve: Y rises steeply as X increases from near-zero, then flattens into a plateau around 20.6–20.8 million as X grows into the billions. This shape is a strong visual signal that a linear model is misspecified for this data.
2. Strength, Direction, and Statistical Uncertainty
The linear Pearson correlation (r = 0.659, R² = 0.434) indicates a moderate positive linear association, but this understates the true relationship — the note that Spearman ρ exceeds Pearson r confirms a monotonic non-linear pattern that linear correlation fails to fully capture. Practically, only 43% of Y's variance is "explained" by a straight-line fit, but a log-transformed model would likely explain substantially more. The 95% CI [0.567, 0.734] is reasonably tight given n=180, and p≈0 confirms the correlation is statistically real, not noise. However, the Granger causality tests (p = 0.969 for X→Y, p = 0.723 for Y→X) show no evidence of temporal predictive power in either direction — despite the strong contemporaneous association, past values of one series do not help forecast future values of the other at up to 10 lags. This is a critical distinction: correlation here is likely structural/mechanical (both driven by a common underlying trend, e.g., time or market growth) rather than causal or dynamically predictive.
3. Notable Patterns and Outliers
The clearest feature is the compression at low X values: dozens of points with X < 500 million show Y ranging widely from ~20.21M to ~20.79M, meaning small-X observations alone produce nearly the full Y range. Beyond X ≈ 1 billion, Y values cluster tightly in a narrow 20.5M–20.8M band regardless of how large X gets (up to 6.27 billion), producing a clear asymptotic ceiling. This is inconsistent with a linear relationship and consistent with log(X) or a saturating function. No extreme outliers break the pattern; the "noise" is concentrated in the low-X region where Y is most volatile.
4. Confounding Factors and Caveats
Both series are Bitcoin-derived metrics measured over overlapping time (2017–2026), so time is a powerful latent confounder — both X and Y likely trend upward with market maturation, adoption, and increasing exchange volumes independent of any direct mechanical link. The mismatched dataset descriptions (X labeled "SplyExpFut10yr" but exhibiting values in the billions, inconsistent with a typical supply-expansion ratio) raise concern about label accuracy or a data-processing artifact — this should be verified before drawing domain conclusions. Additionally, n=180 is a sample from a much larger population (N=3,212), so subsampling method (every 3rd point) could introduce autocorrelation bias given the time-series nature of the data.
5. Recommendations
First, re-fit using a log-transform of X (or both variables) and recompute R² and Spearman ρ to get an honest measure of explained variance — this will likely reveal a much stronger relationship than the linear model suggests. Second, verify the X-axis column definition/units, since the observed range (1.3M to 6.27B) seems inconsistent with a bounded supply-expansion ratio. Third, given the null Granger result, treat this as a contemporaneous/structural association, not a forecasting signal — do not use X to predict future Y or vice versa. Finally, consider detrending both series (e.g., differencing or removing shared time trend) before re-testing correlation and causality, to isolate whether any genuine relationship exists beyond mutual growth over the 2017–2026 period.
X dataset: CryptoDataDownload – Binance BTC/USDT Daily OHLCV
Y dataset: Bitcoin Historical Data (2010-2024)
Part of experiment: Bitcoin - CryptoDataDownload – Binance BTC/USDT Daily OHLCV vs Bitcoin Historical Data (2010-2024)