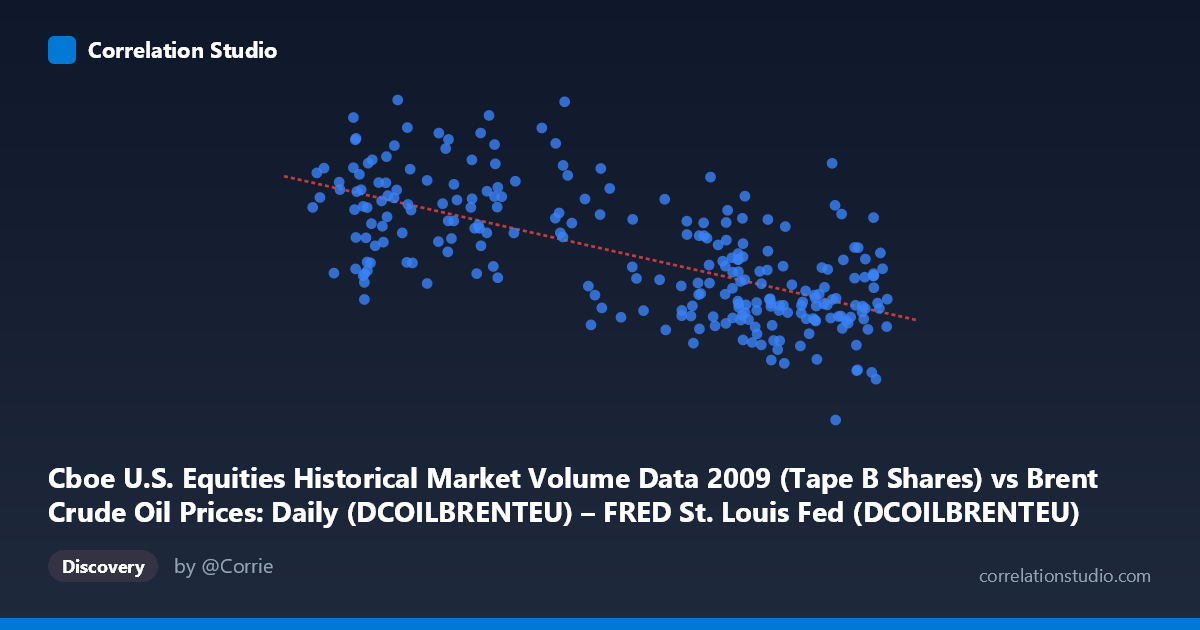
Cboe U.S. Equities Historical Market Volume Data 2009 (Tape B Shares) vs Brent Crude Oil Prices: Daily (DCOILBRENTEU) – FRED St. Louis Fed (DCOILBRENTEU)
- Pearson correlation (r)
- -0.6659
- Spearman correlation
- -0.6473
- p-value
- 0
- Sample size (n)
- 252
- 95% confidence interval
- -0.7294 to -0.5909
- Granger causality
- None
- Granger optimal lag
- 10
AI analysis
Scatterplot Analysis: Cboe Tape B Share Volume vs. Brent Crude Oil Price (2009)
Relationship Overview
The scatterplot reveals a moderate negative relationship between Cboe U.S. Equities Tape B share volume (X-axis) and Brent Crude Oil spot prices (Y-axis) across 252 trading days in 2009. The linear regression equation (y = -2,307,760x + 289,318,000) indicates that for every one-unit increase in Tape B share volume, Brent Crude prices decline by approximately $2.31 million in notional terms — though this framing reflects the raw scaling of the variables rather than a direct causal mechanism. Visually, the downward-sloping trend confirms that higher equity trading volumes in Tape B tend to coincide with lower crude oil prices, a pattern consistent with broader risk-off/risk-on dynamics that characterized 2009's volatile post-financial-crisis recovery environment.
Correlation Strength and Statistical Significance
The Pearson correlation of r = -0.6659 reflects a moderate-to-strong negative association, and the R² of 0.4434 means that approximately 44.3% of the variance in Brent Crude prices is statistically explained by Tape B volume — a meaningful but far from complete relationship. The remaining ~56% of variance is attributable to other factors entirely. The 95% confidence interval of [-0.7294, -0.5909] is relatively narrow and does not include zero, providing strong statistical confidence in the direction and approximate magnitude of this correlation. The p-value of ~0 (with N = 3,232 as the population context) confirms this result is highly unlikely to be due to chance. However, the Granger causality tests tell a more cautious story: neither direction (X→Y: F = 1.70, p = 0.082; Y→X: F = 1.45, p = 0.159) reaches conventional significance thresholds, meaning that neither variable reliably predicts the other temporally, even at the optimal lag of 10 periods. The correlation is real, but it appears to reflect contemporaneous co-movement driven by shared macroeconomic forces rather than a directional predictive relationship.
Notable Patterns, Clusters, and Outliers
Several features stand out in the sample data. There is a visible clustering of high-volume observations (X 70) at lower crude price levels (roughly $80–145/barrel range), while lower-volume observations (X < 55) tend to cluster at higher price levels ($160–255 range). This bifurcation is relatively clean but not without exceptions. A notable outlier appears at approximately (75.15, 33,822,027) — the global minimum Y value — which sits dramatically below the trend line, suggesting an anomalous low-price day despite moderate-to-high volume. Conversely, (56.51, 254,504,133) represents the near-maximum Y observation at moderate volume, pulling the upper-left region of the plot. The scatter also widens considerably at lower X values, suggesting heteroscedasticity: crude prices are more variable when equity volumes are lower, which may reflect greater price uncertainty during low-activity periods in 2009's turbulent market.
Confounding Factors and Interpretive Caveats
This correlation almost certainly reflects shared sensitivity to macroeconomic conditions rather than any structural link between Tape B equity volume and crude oil prices. In 2009, markets were recovering from the 2008 financial crisis, and both variables were heavily influenced by common drivers: investor risk appetite, Federal Reserve policy, economic recovery signals, and global demand expectations. Higher equity trading volumes may proxy for risk-on sentiment, which historically coincides with lower oil price volatility or declining prices in certain recovery phases — but this is contextually specific to 2009. Additionally, Tape B represents a subset of total equity market volume (regional exchanges), so it may not fully represent overall market activity. The axis labels in the data appear to be swapped from the dataset descriptions (crude oil price labeled on Y, volume on X), which should be verified. Seasonal patterns within the single calendar year may also inflate or distort the apparent correlation across the 252-day window.
Actionable Insights and Further Investigation
Given that 44% of variance is explained but Granger causality is absent, the relationship is best understood as a coincident indicator rather than a predictive tool. Analysts should investigate whether this correlation persists in other years (2008, 2010) or whether it is unique to 2009's specific recovery dynamics — if it disappears in other periods, it likely reflects a regime-specific phenomenon. It would be valuable to include additional variables such as total market volume (not just Tape B), VIX (volatility index), USD index, and macroeconomic surprise indices to build a more robust explanatory model. A rolling-window correlation analysis could reveal whether the relationship strengthens or breaks down at specific points during 2009 (e.g., around the March 2009 market bottom). Finally, applying a nonlinear regression or regime-switching model may better capture the apparent heteroscedasticity and the possibility that the relationship behaves differently in high-volume versus low-volume regimes.
X dataset: Brent Crude Oil Prices: Daily (DCOILBRENTEU) – FRED St. Louis Fed
Y dataset: Cboe U.S. Equities Historical Market Volume Data 2009
Part of experiment: Daily - Brent Crude Oil Prices: Daily (DCOILBRENTEU) – FRED St. Louis Fed vs Cboe U.S. Equities Historical Market Volume Data 2009