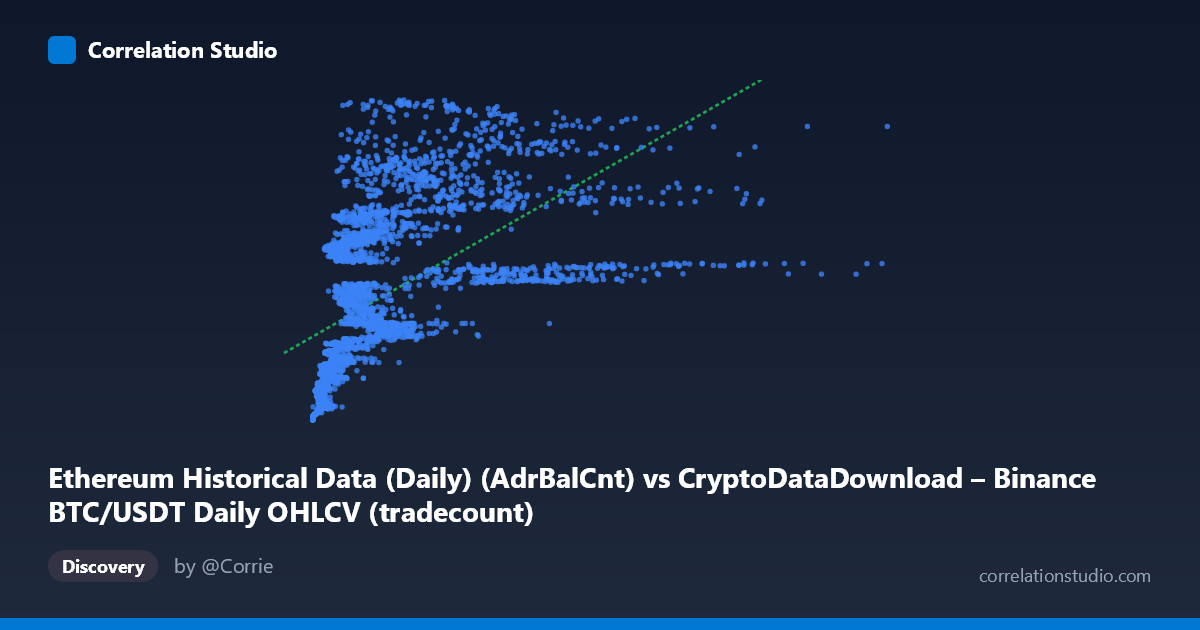
Ethereum Historical Data (Daily) (AdrBalCnt) vs CryptoDataDownload – Binance BTC/USDT Daily OHLCV (tradecount)
- Pearson correlation (r)
- 0.5658
- Spearman correlation
- 0.7894
- p-value
- 0
- Sample size (n)
- 3191
- 95% confidence interval
- 0.5417 to 0.5889
- Granger causality
- None
- Granger optimal lag
- 10
- Time coverage
- 2017-08-17 to 2026-05-20
AI analysis
Analysis: Ethereum Address Balance Count vs. Binance BTC/USDT Trade Count
1. What the Visualization Reveals
The scatterplot shows a positive but noisy relationship between Ethereum's daily active address balance count (X) and Binance BTC/USDT daily trade count (Y). Points generally trend upward from the lower-left to upper-right, but with substantial scatter — particularly notable is that low X-values (under ~1M addresses) map to a very wide range of Y-values (from ~3M to over 150M trades), indicating that X alone is a weak predictor at the lower end of its range. The relationship appears to compress or saturate at higher X-values, consistent with a concave (logarithmic-like) rather than strictly linear shape.
2. Strength, Direction, and Statistical Confidence
The Pearson correlation (r = 0.566) indicates a moderate positive linear relationship, with r² = 0.320 meaning only about 32% of the variance in trade count is explained by address balance count — leaving nearly 70% attributable to other factors or noise. The 95% CI [0.542, 0.589] is tight given the large sample (n=3,191), and the p-value of ~0 confirms the correlation is highly statistically significant — this is a real, non-random association, not strength. Critically, the Granger causality tests show no significant predictive direction in either direction (X→Y: p=0.255; Y→X: p=0.801), meaning neither variable's past values reliably forecast the other's future values at daily granularity. This suggests the correlation is likely driven by a shared underlying trend (e.g., overall crypto market growth/adoption over 2017–2026) rather than one variable mechanically driving the other.
3. Notable Patterns and Non-linear Features
The data shows heteroscedasticity — variance in Y increases substantially as X increases, forming a fan/cone shape rather than a uniform linear band. Several low-X points (e.g., X≈2,000–12,000) correspond to very low Y (~3–4M), likely representing early historical data (2017-2018 launch period) where both ETH and BTC markets were nascent. Conversely, high-Y points (150M+) occur across a wide X range, suggesting periods of extreme BTC trading volume (potentially 2021 bull run or similar volatility spikes) that are decoupled from ETH address growth. The note that Spearman's ρ exceeds Pearson's r supports a monotonic but non-linear (likely logarithmic or power-law) relationship — consistent with diminishing returns as address counts grow into the millions while trade counts continue to scale with market volatility.
4. Confounding Factors and Caveats
This comparison conflates two distinct market mechanisms: an on-chain adoption metric (Ethereum address balance count) with an exchange-specific trading activity metric (Binance BTC/USDT trade count). Both likely share a common confounder: overall cryptocurrency market growth, adoption, and macro sentiment over the 2017–2026 period — both series trend upward over time independent of each other, which can produce spurious correlation via shared temporal drift rather than a causal or mechanistic link. Additionally, BTC trade count on a single exchange (Binance) is influenced by factors unrelated to Ethereum entirely — exchange listing changes, fee structures, competitor exchange volume shifts, and BTC-specific volatility events (halvings, ETF news, etc.).
5. Actionable Insights
Given the lack of Granger causality and the likely shared-trend confound, analysts should detrend both series (e.g., using differencing or removing long-term growth components) before re-testing correlation and causality — this would reveal whether any genuine short-term co-movement exists beyond the common upward trajectory. Fitting a log-log or power-law model may substantially improve fit given the Spearman/Pearson divergence and visual saturation pattern. Finally, since these variables measure fundamentally different assets and platforms, consider whether a more theoretically justified comparison (e.g., ETH address count vs. ETH trade count, or BTC address count vs. BTC trade count) would yield more interpretable and actionable results.
X dataset: CryptoDataDownload – Binance BTC/USDT Daily OHLCV
Y dataset: Ethereum Historical Data (Daily)
Part of experiment: Bitcoin - CryptoDataDownload – Binance BTC/USDT Daily OHLCV vs Ethereum Historical Data (Daily)