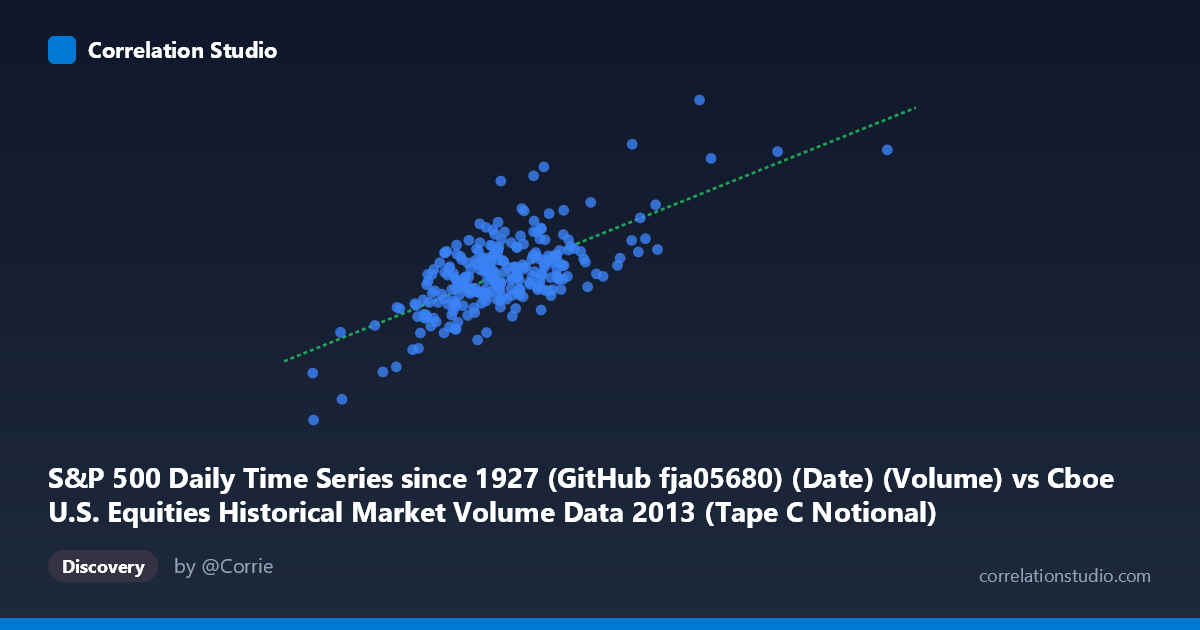
S&P 500 Daily Time Series since 1927 (GitHub fja05680) (Date) (Volume) vs Cboe U.S. Equities Historical Market Volume Data 2013 (Tape C Notional)
- Pearson correlation (r)
- 0.6883
- Spearman correlation
- 0.5671
- p-value
- 0
- Sample size (n)
- 252
- 95% confidence interval
- 0.6173 to 0.7483
- Granger causality
- None
- Granger optimal lag
- 10
AI analysis
Scatterplot Analysis: S&P 500 Volume vs. Cboe Tape C Notional Value (2013)
Relationship Overview
The scatterplot reveals a moderate positive relationship between S&P 500 daily trading volume (X-axis, sourced from GitHub fja05680) and Cboe Tape C notional value (Y-axis) across 252 trading days in 2013. As daily volume increases, Tape C notional value tends to rise correspondingly, which is intuitive — higher share turnover generally translates to greater dollar-denominated transaction value. However, the scatter around the regression line (y = 0.556x + 1.27B) is substantial, indicating that volume alone is far from a complete predictor of notional value. The relationship is broadly linear across the observed range, though considerable dispersion exists at mid-range volume levels (roughly 3.5–4.5B shares), where Y values span nearly 2 trillion dollars for similar X values.
Correlation Strength and Statistical Interpretation
The Pearson correlation of r = 0.688 indicates a moderate-to-strong positive association, but the coefficient of determination (r² = 0.4738) tells a more sobering story: only ~47.4% of the variance in Tape C notional value is explained by trading volume. The remaining ~52.6% is attributable to other factors entirely. The 95% confidence interval of [0.617, 0.748] is reasonably tight, reflecting the adequate sample size (n = 252), and the p-value of effectively zero confirms the correlation is highly statistically significant and not a chance artifact. Critically, however, Granger causality tests found no significant predictive directionality in either direction — neither X→Y (F = 1.25, p = 0.26) nor Y→X (F = 1.44, p = 0.16) — at the optimal 10-period lag. This means that while the two series move together contemporaneously, past values of volume do not reliably predict future notional values, and vice versa. The relationship is associative, not temporally predictive.
Notable Patterns, Clusters, and Outliers
Several features stand out in the point cloud. The sample data reveals a dominant cluster centered around X ≈ 3.6–4.2B shares and Y ≈ 3.0–3.9B notional, representing typical 2013 trading conditions. A few points appear as potential outliers worth flagging: the leftmost point near (1.85B, 1.97B) sits in clear isolation from the main cluster, likely representing an anomalously low-volume day (possibly a holiday-shortened session). Similarly, points near (3.75B, 4.66B) and (3.96B, 4.27B) show elevated notional values relative to their volume, suggesting high-price-per-share activity or index constituent price surges on those days. The lower-left region also contains a small sparse cluster around (2.7–2.9B, 2.0–2.5B), potentially representing early 2013 or holiday-adjacent sessions with suppressed activity.
Confounding Factors and Caveats
Several important caveats should temper interpretation. First, notional value conflates volume with price — the same number of shares traded at higher index levels produces greater notional value, meaning the S&P 500's 2013 bull run (~30% annual gain) would mechanically inflate Tape C notional throughout the year, creating a time-driven spurious component in the correlation. Second, the X-axis label appears to reference a "Volume" column from a date-indexed dataset, raising a potential data alignment concern: if volume figures were joined to notional values by date but stem from different market scopes (S&P 500 composite vs. Cboe Tape C specifically), the correlation partially reflects market-wide trends rather than a clean bilateral relationship. Third, regime changes in market microstructure, algorithmic trading patterns, or single large block trades on specific days could distort both variables simultaneously — a classic common-cause confound.
Actionable Insights and Further Investigation
Practitioners should avoid using lagged volume as a standalone predictor of Tape C notional value, as the Granger causality results clearly counsel against this. Instead, further investigation should decompose the unexplained ~52.6% variance by incorporating index price level (to separate price effect from volume effect on notional), volatility measures (e.g., VIX), and day-of-week or month-end effects. A partial correlation or multivariate regression controlling for S&P 500 closing price would clarify whether the volume-notional relationship persists after accounting for the index's 2013 upward trend. Additionally, testing for structural breaks around major 2013 events (Fed taper tantrum in May–June) could reveal whether the relationship was stable across the year or regime-dependent — the sparse lower-left cluster hints at possible segmentation worth examining.
X dataset: Cboe U.S. Equities Historical Market Volume Data 2013
Y dataset: S&P 500 Daily Time Series since 1927 (GitHub fja05680) (Date)
Part of experiment: Daily - Cboe U.S. Equities Historical Market Volume Data 2013 vs S&P 500 Daily Time Series since 1927 (GitHub fja05680) (Date)