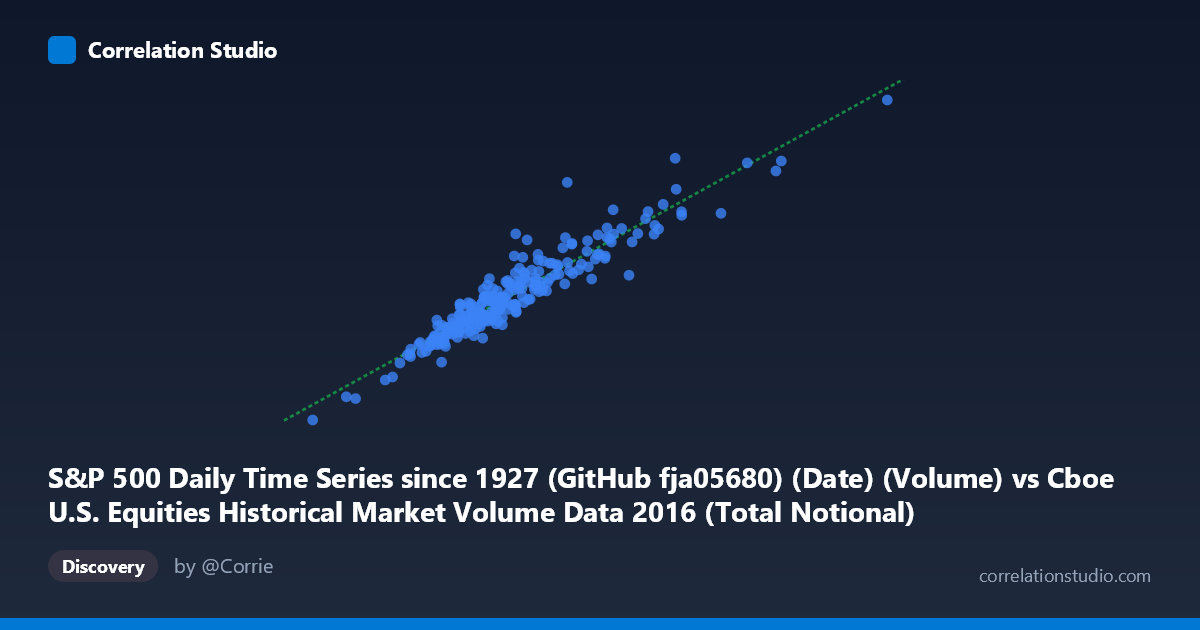
S&P 500 Daily Time Series since 1927 (GitHub fja05680) (Date) (Volume) vs Cboe U.S. Equities Historical Market Volume Data 2016 (Total Notional)
- Pearson correlation (r)
- 0.9437
- Spearman correlation
- 0.9342
- p-value
- 0
- Sample size (n)
- 252
- 95% confidence interval
- 0.9284 to 0.9558
- Granger causality
- None
- Granger optimal lag
- 10
- Time coverage
- 2016-01-04 to 2016-12-30
AI analysis
Analysis: S&P 500 Daily Volume vs. Cboe Total Notional Value (2016)
Relationship Overview The scatterplot reveals a strong, positive linear relationship between S&P 500 daily trading volume and Cboe U.S. Equities total notional value throughout 2016. As daily share volume increases, the total notional value of trades rises proportionally, which is intuitively sensible — more shares traded naturally translates to greater dollar value transacted. The data points cluster tightly around the regression line (y = 0.178x + 5.15×10⁸), indicating that this relationship is remarkably consistent across the full year, with relatively little scatter around the central tendency.
Correlation Strength and Statistical Significance The Pearson correlation of r = 0.9437 is exceptionally strong, and the coefficient of determination r² = 0.8905 tells us that approximately 89.1% of the variance in total notional value is explained by trading volume alone. This is a practically substantial explanatory relationship. The 95% confidence interval of [0.9284, 0.9558] is narrow, confirming high precision in this estimate, and the p-value of effectively zero leaves no doubt about statistical significance across the n = 252 paired daily observations drawn from a population of N = 3,622. However, the Granger causality results are notable and cautionary: neither direction (X→Y nor Y→X) achieves significance at the optimal 10-period lag (F = 0.54, p = 0.86 and F = 0.43, p = 0.93, respectively). This means that while the two series are tightly correlated contemporaneously, neither variable's past values meaningfully predict the other's future values — suggesting they move together due to shared underlying drivers rather than one causing the other.
Patterns, Clusters, and Outliers The sample points span X values roughly between ~12.7 billion and ~25 billion shares, with Y values between approximately $2.65 billion and $5.08 billion notional. A few high-volume days (e.g., ~25.1B volume / $5.08B notional and ~24.1B / $4.69B) stand out at the upper right of the plot, likely corresponding to known volatility events or index rebalancing days in 2016. At the lower left, points around 12.7–14.0 billion shares with notional values below $3 billion represent quieter trading sessions. The overall distribution appears roughly linear with no strong evidence of heteroscedasticity or non-linearity across the observed range, though the sparse upper tail warrants attention.
Confounding Factors and Caveats Despite the high r², this correlation should be interpreted carefully. Both variables are fundamentally linked by construction — notional value is the product of volume and price, meaning any day with high volume will mechanically tend to produce high notional value, especially if intraday prices are stable. This creates an inherent mathematical coupling that inflates the apparent correlation beyond what would reflect independent phenomena. Additionally, market-wide conditions in 2016 — including the U.S. presidential election in November and Brexit-related volatility — likely drove simultaneous spikes in both metrics, acting as common confounders. The data covers only a single calendar year, limiting generalizability. The Granger non-causality result further reinforces that this is a concurrent co-movement story, not a predictive one.
Actionable Insights and Further Investigation Practitioners should avoid using lagged volume to predict future notional value (or vice versa) based on this data, as Granger causality provides no support for such a strategy. More productive avenues would include: (1) decomposing the relationship by market regime (high vs. low volatility periods, pre/post-election) to test whether the correlation is stable or driven by episodic spikes; (2) incorporating price level as an explicit third variable, since notional = volume × price, to disentangle the mathematical identity from genuine behavioral co-movement; (3) extending the time series across multiple years to test whether the r² of ~0.89 is stable or an artifact of 2016's specific conditions; and (4) examining whether specific exchange venues within the Cboe data drive the relationship disproportionately, which could reveal structural microstructure effects worth modeling independently.
X dataset: Cboe U.S. Equities Historical Market Volume Data 2016
Y dataset: S&P 500 Daily Time Series since 1927 (GitHub fja05680) (Date)
Part of experiment: Daily - Cboe U.S. Equities Historical Market Volume Data 2016 vs S&P 500 Daily Time Series since 1927 (GitHub fja05680) (Date)