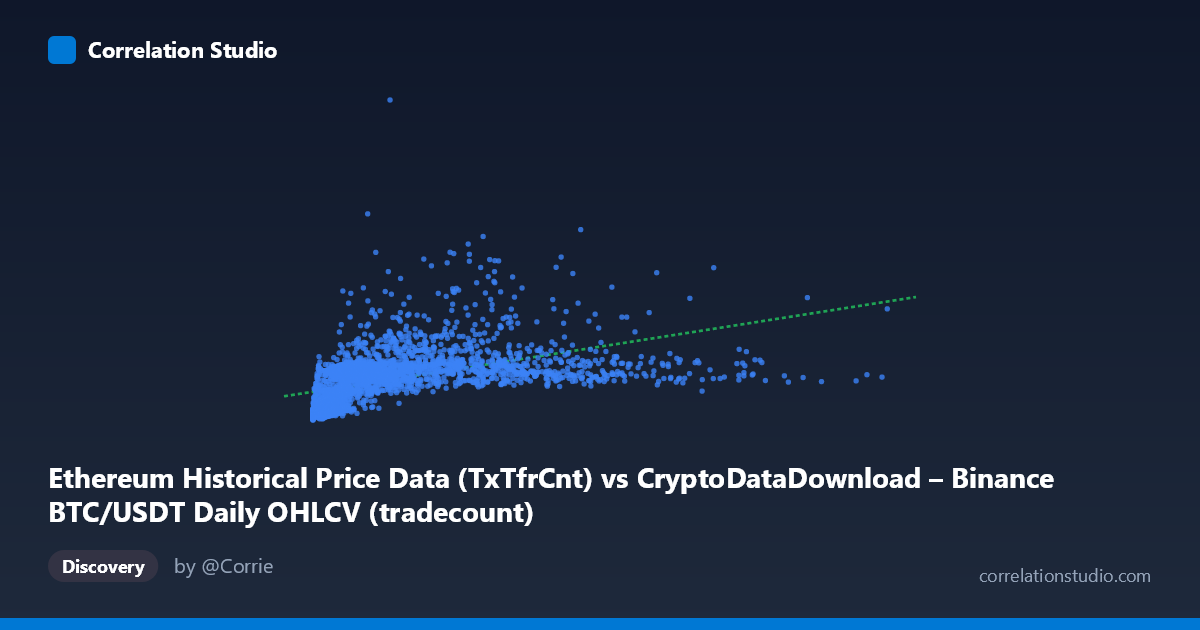
Ethereum Historical Price Data (TxTfrCnt) vs CryptoDataDownload – Binance BTC/USDT Daily OHLCV (tradecount)
- Pearson correlation (r)
- 0.4937
- Spearman correlation
- 0.7238
- p-value
- 0
- Sample size (n)
- 3191
- 95% confidence interval
- 0.467 to 0.5195
- Granger causality
- None
- Granger optimal lag
- 10
- Time coverage
- 2017-08-17 to 2026-05-20
AI analysis
Analysis: Ethereum Transfer Count vs. BTC/USDT Tradecount
1. Relationship Overview
The scatterplot depicts a moderate positive relationship between Ethereum daily transaction counts (X) and Binance BTC/USDT tradecount (Y). Most points cluster tightly in the lower-left region (X < 2M, Y < 1.5M), with a long, sparse tail extending toward high-X outliers (up to ~15.4M). This heavily right-skewed distribution—evident from the mean (1.97M) sitting far above the median implied by the dense cluster—suggests the data is not well-described by a simple linear model across its full range, despite the moderate correlation coefficient.
2. Strength, Direction, and Statistical Confidence
The Pearson correlation (r = 0.494, r² = 0.244) indicates a moderate positive linear relationship, but only about 24% of the variance in BTC tradecount is explained by ETH transfer count—leaving roughly 76% driven by other factors. The 95% CI [0.467, 0.520] is narrow and the p-value is effectively 0, so we can be highly confident the true population correlation is non-zero and reasonably estimated (a testament to the large sample size, n=3,191, rather than evidence of a strong or reliable predictive relationship). Critically, Granger causality tests show no significant predictive direction in either direction (X→Y: p=0.28; Y→X: p=0.79) at the optimal lag of 10 periods. This means neither series meaningfully helps forecast the other's future values based on past behavior—the correlation appears to be a contemporaneous co-movement (likely driven by shared market-wide conditions) rather than a causal or lead-lag relationship.
3. Notable Patterns and Outliers
The dense cluster of points (X roughly 0–3M, Y roughly 300K–1.5M) represents the "typical" trading regime, where the relationship looks weakly linear at best. Several high-leverage outliers—particularly the point near (15.36M, ~unclear Y) and others above X=5M (e.g., 6.03M, 8.27M, 8.70M)—sit far from the main cloud and likely exert disproportionate influence on both the Pearson r and the regression slope. A few Y-outliers also stand out (e.g., Y≈2.7M at X≈4.19M, Y≈1.85M at X≈2.79M), suggesting episodic spikes in BTC trading activity not matched by proportional ETH activity spikes. The note that Spearman ρ exceeds Pearson r is a strong signal of monotonic but non-linear structure—likely logarithmic or power-law, consistent with the heavy right-skew in both variables (typical of blockchain/exchange volume metrics).
4. Confounding Factors and Caveats
Both variables are activity/volume proxies for cryptocurrency markets and are almost certainly driven by common macro factors: overall crypto market sentiment, BTC/ETH price levels, bull/bear cycles, exchange listing events, and network congestion episodes (e.g., NFT booms, DeFi surges) that inflate Ethereum transfer counts independent of BTC trading. This shared exposure to market-wide volatility is a classic confounding structure that can produce moderate correlation without any direct causal link—consistent with the null Granger causality result. Additionally, mixing two different data sources/platforms (on-chain Ethereum metrics vs. Binance-specific BTC trade counts) introduces measurement heterogeneity; scale mismatches (X range spans ~7,100x, Y range spans ~28x) suggest a log transformation is needed before drawing conclusions from raw linear correlation.
5. Recommendations
- Re-fit with log-log or log-linear transformation given the Spearman/Pearson divergence and extreme skew—this will likely reveal a cleaner and possibly stronger relationship. - Winsorize or separately analyze outliers (X 5M) to test whether the correlation is driven by a handful of extreme-activity days (e.g., market crashes or euphoria events). - Treat correlation as descriptive, not predictive—given the null Granger results, avoid using ETH transfer count as a leading indicator for BTC trading volume in forecasting models. - Investigate a common driver variable (e.g., aggregate crypto market cap, VIX-equivalent volatility index, or BTC/ETH price returns) that may explain the shared variance more directly than either series explains the other. - Segment by time period (2017–2026 spans multiple market cycles) to check whether the correlation strength is stable or regime-dependent, since pooling bull and bear markets can mask structural breaks.
X dataset: CryptoDataDownload – Binance BTC/USDT Daily OHLCV
Y dataset: Ethereum Historical Price Data
Part of experiment: Bitcoin - CryptoDataDownload – Binance BTC/USDT Daily OHLCV vs Ethereum Historical Price Data