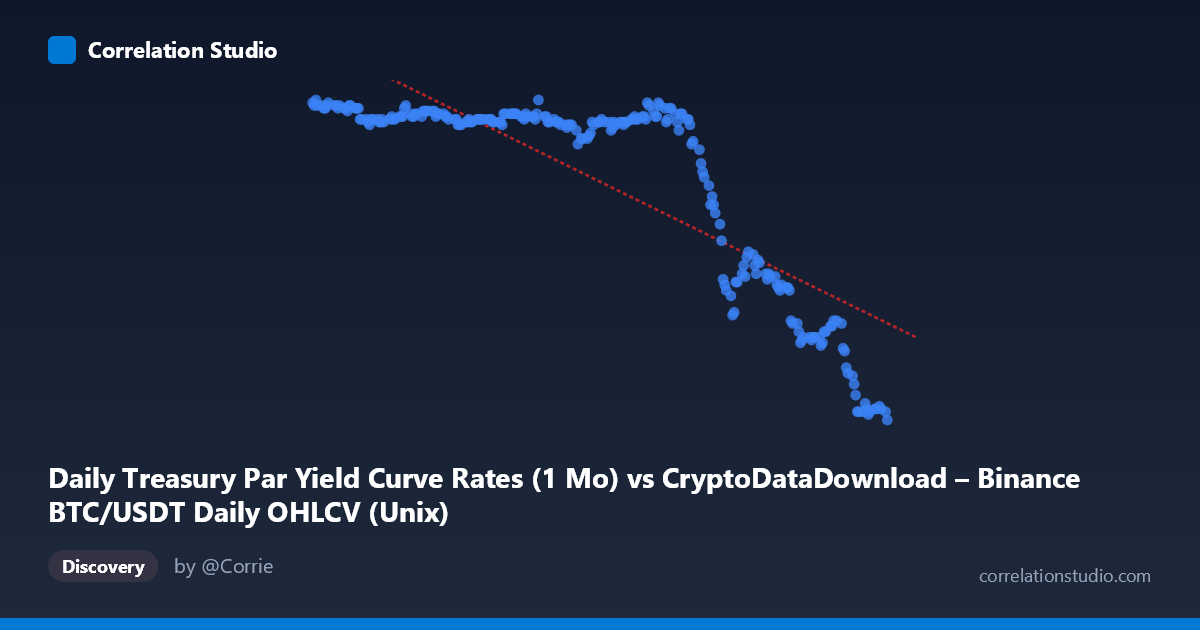
Daily Treasury Par Yield Curve Rates (1 Mo) vs CryptoDataDownload – Binance BTC/USDT Daily OHLCV (Unix)
- Pearson correlation (r)
- -0.8321
- Spearman correlation
- -0.8022
- p-value
- 0
- Sample size (n)
- 250
- 95% confidence interval
- -0.8667 to -0.7895
- Granger causality
- None
- Granger optimal lag
- 1
- Time coverage
- 2024-01-02 to 2024-12-31
AI analysis
Analysis: Treasury Yield (1-Mo) vs. Time-Indexed Series
1. What the Visualization Reveals
The scatterplot shows a clear negative, moderately strong relationship between the 1-Month Treasury Par Yield and the time-indexed variable (labeled as X, spanning Jan–Dec 2024). The data is not randomly scattered but instead reveals a two-regime structure: a long, flat plateau where Y hovers around 5.47–5.55 (roughly January through August 2024), followed by a step-down decline beginning around September–October 2024, with Y falling steadily into the 4.4–4.9 range by December. This is not a smooth linear cloud but more of a "plateau-then-descent" pattern typical of a policy rate holding steady before a series of cuts.
2. Strength, Direction, and Statistical Confidence
The correlation coefficient (r = -0.832, R² = 0.692) indicates a strong negative linear association, with roughly 69% of the variance in Y statistically explained by X (or, more accurately, by the time trend X represents). The 95% CI [-0.867, -0.790] is narrow and does not cross zero, and the p-value is effectively 0, confirming this relationship is highly unlikely to be due to chance given n=250. However, Granger causality tests show no significant predictive direction in either direction (X→Y: p=0.64; Y→X: p=0.135). This is a critical caveat: despite the strong contemporaneous correlation, neither series' past values help forecast the other's future values at a 1-period lag. This strongly suggests the correlation is driven by a shared trend over time rather than a genuine causal or lead-lag dynamic — both series are moving with the calendar, not necessarily with each other.
3. Notable Patterns and Non-linearity
The relationship is distinctly non-linear/piecewise: an extended flat high-rate regime (Jan–Aug) transitions into a declining regime (Sep–Dec) with what appears to be discrete step-downs (e.g., clusters at 5.5, 5.25, 4.9, 4.7, 4.4) rather than continuous decay. This is consistent with discrete Federal Reserve rate-decision dates rather than a smooth economic process. The linear regression (R²=0.692) understates the fit within each regime (which is very tight) and overstates the "linearity" of the overall process — a piecewise or step-function model would likely fit better than a straight line.
4. Confounding Factors and Caveats
The core issue here is that X is itself a timestamp (Unix time for BTC/USDT OHLCV records), meaning this is fundamentally a time-series-vs-time plot in disguise rather than a relationship between two independent economic variables. Any two series that both trend over the same calendar period (one flat-then-down, driven by Fed policy) will show spurious correlation purely from shared temporal structure. This is a classic case where correlation reflects autocorrelation and trend confounding, not a substantive economic relationship between BTC trading data and Treasury yields. The lack of Granger causality reinforces that this is likely a spurious/trend-driven correlation rather than one series informing the other.
5. Suggestions for Further Investigation
1. De-trend both series (e.g., first-difference or detrend by removing the shared time component) and re-test correlation — this will reveal whether any real relationship exists beyond the mutual trend. 2. Segment the analysis by regime (pre/post rate-cut cycle) rather than fitting a single linear model, since the step-like Fed policy pattern is being averaged out. 3. Clarify variable roles: given X is a timestamp column, confirm whether the intended comparison was actually BTC price series against Treasury yield, not against Unix time — the current setup should likely have used BTC Close price as X, not the date field. 4. Use cross-correlation at multiple lags (not just 1 period) to check for delayed effects, since Fed rate cuts may influence crypto/risk assets with a lag greater than one day.
X dataset: CryptoDataDownload – Binance BTC/USDT Daily OHLCV
Y dataset: Daily Treasury Par Yield Curve Rates
Part of experiment: Bitcoin - CryptoDataDownload – Binance BTC/USDT Daily OHLCV vs Daily Treasury Par Yield Curve Rates