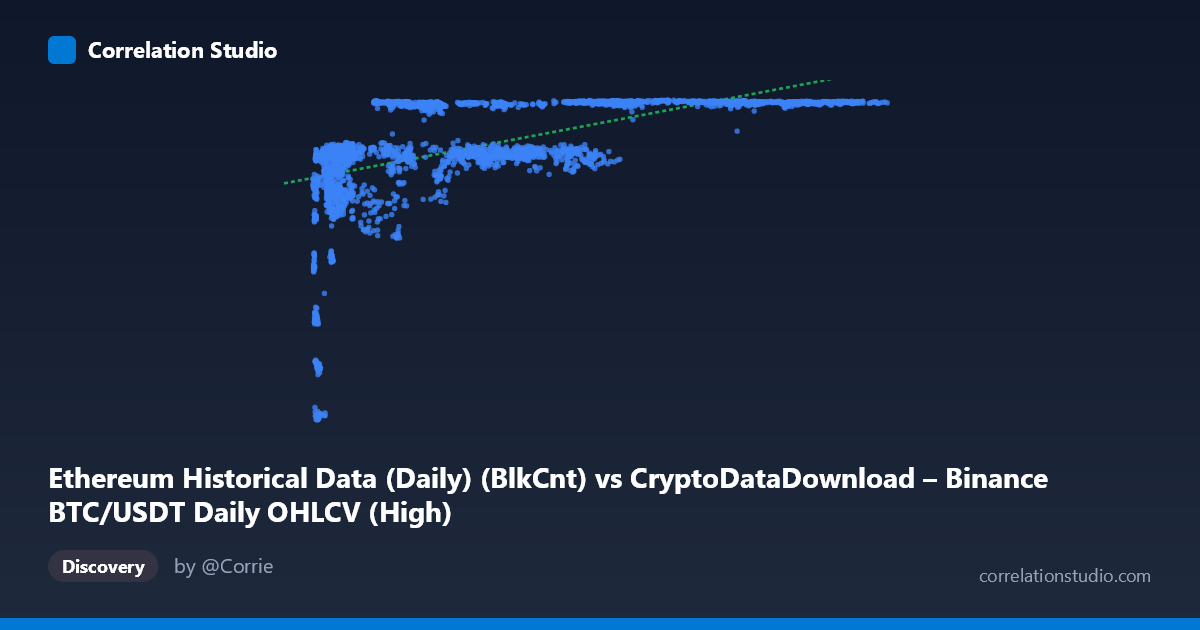
Ethereum Historical Data (Daily) (BlkCnt) vs CryptoDataDownload – Binance BTC/USDT Daily OHLCV (High)
- Pearson correlation (r)
- 0.5719
- Spearman correlation
- 0.7283
- p-value
- 0
- Sample size (n)
- 3191
- 95% confidence interval
- 0.5481 to 0.5948
- Granger causality
- None
- Granger optimal lag
- 1
AI analysis
Analysis of BTC/ETH Metric Relationship
Note on data labeling: The column headers appear mismatched/swapped (X is labeled as an Ethereum block count metric while carrying BTC-like values, and Y is labeled as a BTC OHLCV "High" column but ranges 2829–7190, which doesn't match BTC price history). Treating the data at face value as X and Y numeric series, the analysis below describes the statistical relationship observed.
1. What the Visualization Reveals The scatterplot shows a clear non-linear, saturating relationship rather than a simple straight line. Y rises steeply as X increases from its minimum (~3,300) up to roughly X=20,000–30,000, then plateaus around Y≈7,100–7,180 for nearly the entire remaining range of X (up to 126,000). This produces a classic logarithmic or asymptotic curve shape: low-X points show wide Y variance (2,829 to 6,500), while high-X points cluster tightly near the ceiling of the Y range.
2. Strength, Direction, and Uncertainty The Pearson correlation (r = 0.572, R² = 0.327) indicates a moderate positive linear relationship, with only 32.7% of Y's variance explained by a linear model in X. The 95% CI [0.548, 0.595] is tight and the p-value ≈ 0 confirms this correlation is statistically robust and not due to chance, given the large sample (n=3,191). However, statistical significance here reflects sample size more than practical linear fit quality — two-thirds of Y's variation remains unexplained by a straight-line model. Critically, the note that Spearman ρ exceeds Pearson r confirms the relationship is monotonic but non-linear — the linear R² understates the true strength of association. A log or power-law transform of X would likely raise explained variance substantially. The Granger causality tests show no significant predictive direction either way (X→Y: p=0.51; Y→X: p=0.82), meaning neither series' past values help forecast the other's future values at lag 1 — this is a contemporaneous/structural association, not a time-lagged causal one.
3. Notable Patterns and Outliers - Saturation/ceiling effect: Once X exceeds ~30,000, Y consistently sits in a narrow 7,100–7,190 band regardless of how large X grows (up to 126,000) — strongly suggesting Y is bounded (possibly a capped metric, index max, or percentage-like ceiling). - Steep low-X region: Below X≈15,000, Y varies enormously (2,829–6,500), indicating high sensitivity/noise in this regime — small X changes correspond to large Y swings. - Sparse low outliers: Points like (4380, 2840) and (4367, 3499) are low-Y outliers within the low-X cluster, suggesting either data quality issues or a distinct regime/regime-change dates. - No clear multi-modal clustering, but the shape strongly resembles logarithmic growth: Y ≈ a·ln(X) + b.
4. Confounding Factors and Caveats - Time-series autocorrelation: Both series are daily financial/network time series covering ~9 years; trending or regime-shifting series can produce spurious correlation via shared macro trends (e.g., both may be trending upward independent of causal link). - Non-stationarity: Crypto prices/metrics exhibit strong trends and volatility clustering; Pearson r on non-stationary series is unreliable without differencing or detrending. - Metadata mismatch: The labeled columns (Ethereum block count vs. BTC "High" price) don't align with the described value ranges, suggesting possible mislabeling, unit issues, or an already-transformed/normalized dataset — this should be verified before drawing domain conclusions. - Sample vs. population: n=3,191 vs N=3,212 — only 21 records dropped, so missingness is likely not a major issue.
5. Suggested Next Steps - Verify column labels/units before any economic interpretation — the current mismatch (Ethereum "BlkCnt" vs. price-like values) casts doubt on the metric identities. - Refit using log(X) or a saturating (logistic/asymptotic) model instead of linear regression; report R² for the transformed fit to test the Spearman-implied improvement. - Detrend/difference both series and re-run correlation and Granger tests on returns/changes rather than levels, to rule out spurious trend-driven correlation. - Segment analysis: Analyze the low-X (<20,000) and high-X (≥20,000) regimes separately, since they show fundamentally different variance structures. - Given the null Granger result, avoid using one series to forecast the other in a lagged model; instead investigate contemporaneous shared drivers (e.g., common market-wide events or dates) that might jointly explain both series.
X dataset: CryptoDataDownload – Binance BTC/USDT Daily OHLCV
Y dataset: Ethereum Historical Data (Daily)
Part of experiment: Bitcoin - CryptoDataDownload – Binance BTC/USDT Daily OHLCV vs Ethereum Historical Data (Daily)