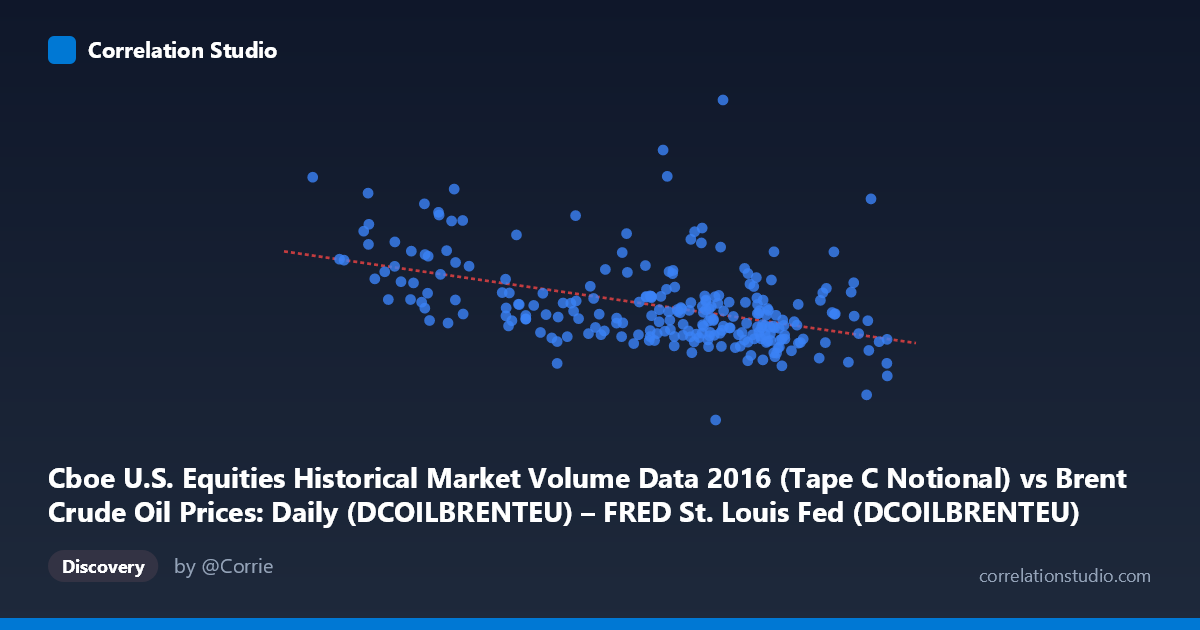
Cboe U.S. Equities Historical Market Volume Data 2016 (Tape C Notional) vs Brent Crude Oil Prices: Daily (DCOILBRENTEU) – FRED St. Louis Fed (DCOILBRENTEU)
- Pearson correlation (r)
- -0.46
- Spearman correlation
- -0.466
- p-value
- 0
- Sample size (n)
- 251
- 95% confidence interval
- -0.5524 to -0.3565
- Granger causality
- None
- Granger optimal lag
- 10
AI analysis
Scatterplot Analysis: Brent Crude Oil Price vs. Cboe U.S. Equities Market Volume (2016)
Relationship Overview
The scatterplot reveals a negative relationship between daily Brent crude oil prices (X-axis, USD/barrel) and Cboe U.S. equities notional trading volume (Y-axis), meaning that as crude oil prices were higher during 2016, equity market trading volumes tended to be lower. The linear regression equation (y = -7.83×10⁷x + 8.41×10⁹) quantifies this inverse slope, suggesting that each additional dollar per barrel in oil price is associated with a reduction of approximately $78 million in notional equity trading volume. This pattern spans a calendar year (January–December 2016), a period during which Brent crude recovered from historic lows near $26/barrel to approximately $55/barrel, providing meaningful natural variation across the X range.
Correlation Strength, Direction, and Statistical Context
The Pearson correlation of r = -0.46 reflects a moderate negative association, but the explanatory power is notably limited: r² = 0.2116 means only ~21% of the variance in equity trading volume is explained by oil price movements. The remaining ~79% of variance is driven by factors entirely outside this relationship. The 95% confidence interval of [-0.55, -0.36] is meaningfully away from zero, and the p-value of 1.51×10⁻¹⁴ confirms the association is highly statistically significant — virtually ruling out chance as an explanation given the sample of n = 251 from a population of N = 3,622 trading observations. However, statistical significance here is a function of the large sample and should not be conflated with practical or economic significance. Critically, the Granger causality tests show no significant predictive direction in either direction (X→Y: F = 0.39, p = 0.95; Y→X: F = 0.51, p = 0.88), meaning that past oil prices do not help predict future equity volumes, and vice versa. This absence of temporal predictability strongly cautions against any causal interpretation of the correlation.
Notable Patterns, Clusters, and Outliers
Several structural features stand out in the data:
- Clustering at higher X values (45–52 USD/barrel): The bulk of observations concentrate in this range, reflecting that Brent crude spent most of mid-to-late 2016 in this band. Within this cluster, Y values show high vertical dispersion, indicating that oil price alone is a poor predictor of volume at these price levels. - High-leverage outliers at low X values: Points at the extreme left (X ≈ 26–33 USD/barrel, early 2016) tend to show elevated Y values (e.g., ~$8.5B, ~$7.3B, ~$6.4B), which disproportionately drive the negative slope. These correspond to January–February 2016, a period of extreme market stress and volatility that would naturally produce high trading volumes independent of oil price per se. - Outliers at high Y values across mid-range X: Points like (45.60, 6.72B) and (47.78, 6.02B) sit well above the regression line, suggesting episodic volume spikes even when oil prices were moderate — likely driven by event-driven trading unrelated to oil. - The overall scatter is wide and heteroscedastic, with variance in Y appearing larger at lower X values, undermining the assumptions of a simple linear model.
Confounding Factors and Interpretive Caveats
This correlation almost certainly reflects shared temporal trends rather than a direct economic mechanism. In early 2016, Brent crude hit multi-year lows amid global growth fears, simultaneously triggering heightened equity market volatility and elevated trading volumes — a classic "risk-off" environment. As crude recovered through the year, markets stabilized and volumes normalized. This means both variables are jointly responding to a common driver (macroeconomic uncertainty, risk sentiment, Federal Reserve policy expectations) rather than one causing the other. Additional confounders include: end-of-quarter rebalancing flows inflating volume independently; OPEC production announcements affecting oil prices discretely; and the fact that Cboe notional volume reflects all U.S. equities, not just energy-sector names that would have the most direct oil price sensitivity. The axis labeling also appears swapped relative to the dataset descriptions, warranting a data integrity check before drawing further conclusions.
Actionable Insights and Further Investigation
Given the moderate correlation, absent Granger causality, and likely confounding from shared macro drivers, several investigative steps are warranted:
1. Decompose the volume data by sector (e.g., energy vs. technology) to test whether the oil-volume relationship is stronger within energy equities specifically. 2. Include a volatility index (VIX) as a control variable in a multivariate regression — it likely mediates much of the observed correlation and would substantially reduce the oil price coefficient. 3. Extend the time window beyond 2016 to test whether this negative correlation is a structural feature or an artifact of that year's particular oil price recovery trajectory. 4. Explore non-linear models (e.g., regime-based or piecewise regression), given the apparent threshold behavior at the low-price/high-volume cluster. 5. Re-examine the optimal lag structure beyond the 10-period window tested, as oil market shocks may propagate to equity trading behavior over longer horizons such as monthly cycles.
X dataset: Brent Crude Oil Prices: Daily (DCOILBRENTEU) – FRED St. Louis Fed
Y dataset: Cboe U.S. Equities Historical Market Volume Data 2016
Part of experiment: Daily - Brent Crude Oil Prices: Daily (DCOILBRENTEU) – FRED St. Louis Fed vs Cboe U.S. Equities Historical Market Volume Data 2016