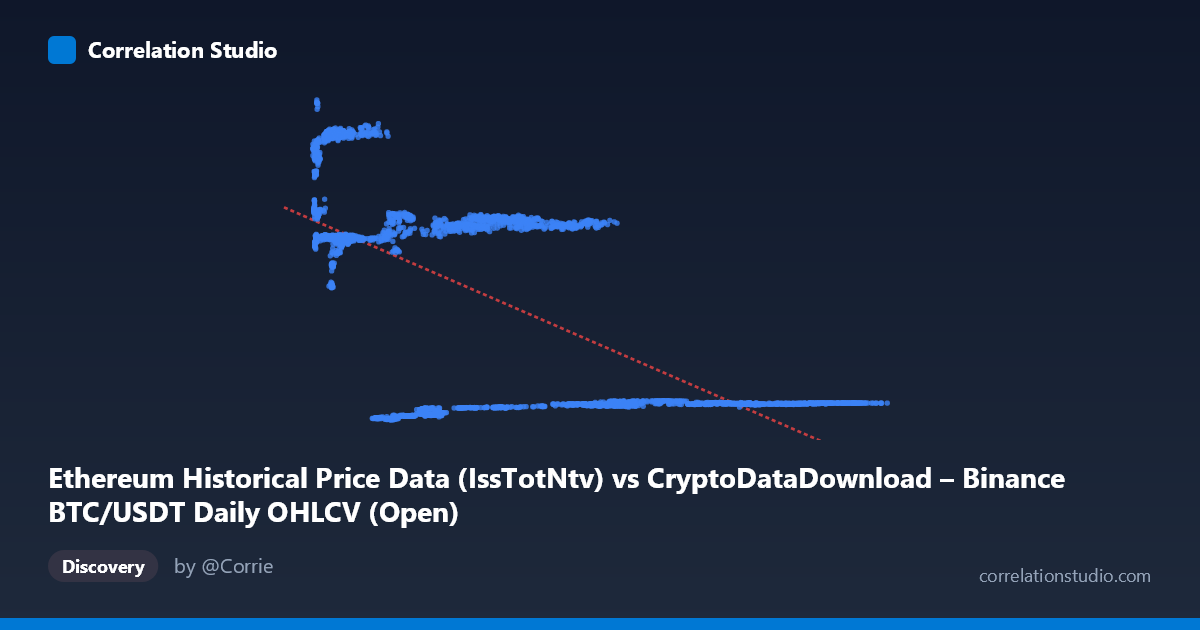
Ethereum Historical Price Data (IssTotNtv) vs CryptoDataDownload – Binance BTC/USDT Daily OHLCV (Open)
- Pearson correlation (r)
- -0.6402
- Spearman correlation
- -0.4721
- p-value
- 0
- Sample size (n)
- 3191
- 95% confidence interval
- -0.6602 to -0.6192
- Granger causality
- Y → X
- Granger optimal lag
- 10
AI analysis
Analysis: BTC/USDT vs Ethereum Metric Correlation
1. Overview of the Relationship
The scatterplot displays a moderate negative relationship between the X variable (labeled as Ethereum "IssTotNtv" but sourced from Binance BTC/USDT data) and Y (labeled as BTC/USDT Open price, but sourced from an Ethereum dataset). Note: the axis labels and data source descriptions appear to be cross-mismatched/swapped, which is an important caveat addressed below. Visually, the data does not form a single continuous cloud but instead clusters into several distinct horizontal bands (roughly around Y≈2,000-2,800, Y≈13,400-14,900, and Y≈18,500-20,700), suggesting the relationship may be driven by regime shifts or discretized time periods rather than a smooth continuous function.
2. Strength, Direction, and Statistical Confidence
The correlation coefficient (r = -0.640) indicates a moderate-to-strong negative linear relationship: as X increases, Y tends to decrease. The r² of 0.410 means only about 41% of the variance in Y is explained by X — a substantial but far from complete relationship, leaving ~59% of variance driven by other factors. The 95% confidence interval [-0.660, -0.619] is tight and does not cross zero, and the p-value of ~0 confirms this correlation is highly statistically significant and not due to chance, though statistical significance here is partly a function of the large sample size (n=3,191).
The Granger causality results add an important temporal dimension: Y Granger-causes X (F=1.876, p=0.044) at a 10-period lag, while X does not Granger-cause Y (F=0.637, p=0.783). This suggests that past values of Y have modest predictive power for future values of X, but not vice versa — implying a unidirectional, though statistically weak (p is close to the 0.05 threshold), temporal precedence rather than mutual reinforcement.
3. Patterns, Clusters, and Non-linearities
The most striking feature is the banding structure in Y values — data clusters tightly around specific Y levels (~2,000-2,800, ~13,400-14,900, ~18,500-20,700) rather than varying continuously. This is a strong indicator of price discretization or regime-based clustering, possibly reflecting different time periods, market cycles, or even mismatched/aggregated data. Within each band, X shows a negative slope, but the overall negative correlation across the full dataset is heavily influenced by the fact that low-X points cluster at high-Y bands and high-X points cluster at low-Y bands. This is not a simple linear decay but rather a step-like or regime-dependent relationship, which linear r/r² metrics can understate or misrepresent.
4. Confounding Factors and Caveats
Several major caveats apply: - Metadata mismatch: The axis labels reference "Ethereum IssTotNtv" and "BTC/USDT Open," but the dataset descriptions reference the opposite pairing — this needs to be resolved before drawing asset-specific conclusions. - Autocorrelation: Both series are financial time series with strong internal autocorrelation (trends, momentum), which inflates apparent correlation and Granger causality significance independent of any true causal link. - Non-stationarity: Cryptocurrency prices are highly non-stationary (trending, volatile); regressing levels rather than returns can produce spurious correlations. - Confounding market factors: Both BTC and ETH are driven by shared macro factors (overall crypto market sentiment, BTC dominance, regulatory news, liquidity cycles) — the correlation likely reflects common market-wide drivers rather than a direct causal price relationship between the two assets.
5. Recommendations for Further Investigation
1. Resolve the labeling discrepancy between axis titles and dataset source descriptions before publishing conclusions. 2. Re-run analysis on log returns rather than price levels to address non-stationarity and reduce spurious correlation/causality effects. 3. Investigate the banding structure — segment the data by time period to determine if clusters correspond to distinct market regimes (bull/bear cycles) or aggregation artifacts. 4. Test Granger causality on differenced/detrended series to confirm the unidirectional signal (p=0.044) is robust and not an artifact of shared trend. 5. Include a third variable (e.g., overall crypto market cap or BTC dominance) as a control to check whether the BTC-ETH relationship is direct or mediated by broader market conditions.
X dataset: CryptoDataDownload – Binance BTC/USDT Daily OHLCV
Y dataset: Ethereum Historical Price Data
Part of experiment: Bitcoin - CryptoDataDownload – Binance BTC/USDT Daily OHLCV vs Ethereum Historical Price Data