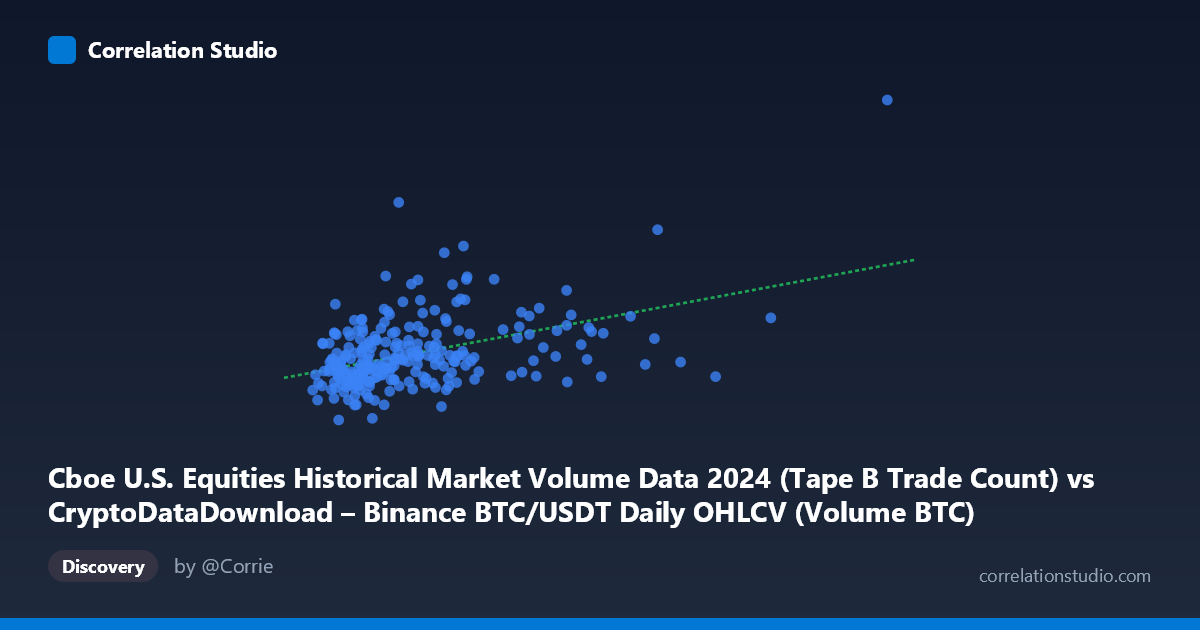
Cboe U.S. Equities Historical Market Volume Data 2024 (Tape B Trade Count) vs CryptoDataDownload – Binance BTC/USDT Daily OHLCV (Volume BTC)
- Pearson correlation (r)
- 0.4418
- Spearman correlation
- 0.3905
- p-value
- 0
- Sample size (n)
- 252
- 95% confidence interval
- 0.3366 to 0.5361
- Granger causality
- None
- Granger optimal lag
- 10
- Time coverage
- 2024-01-02 to 2024-12-31
AI analysis
Analysis: Cboe Trade Count vs. Binance BTC/USDT Volume
1. Overview of the Relationship
The scatterplot shows a positive but noisy relationship between two variables that, notably, are mislabeled/cross-referenced in the metadata — the actual comparison appears to be between a Cboe equities trade-count metric (X) and Binance BTC/USDT trading volume (Y). The bulk of the 252 daily observations cluster tightly in the lower-left region (X: ~20,000–55,000; Y: ~300,000–600,000), with a long right-tail extending to a single extreme outlier at (162,066, 1,170,416) that sits far beyond the rest of the data in both dimensions.
2. Strength, Direction, and Statistical Confidence
The correlation coefficient (r = 0.44) indicates a moderate positive relationship, but r² = 0.195 reveals that only about 19.5% of the variance in Y is explained by X — meaning roughly 80% of the movement in Bitcoin trading volume is driven by factors unrelated to the Cboe trade-count metric. The 95% CI [0.337, 0.536] is reasonably tight and excludes zero, and the p-value (1.8×10⁻¹³) confirms this correlation is highly statistically significant and not due to chance. However, statistical significance with a large-ish sample should not be conflated with practical predictive power — r² of ~0.2 is a weak-to-moderate effect size in practical terms. Critically, the Granger causality tests show no significant predictive direction in either direction (X→Y: p=0.64; Y→X: p=0.88), meaning that despite the contemporaneous correlation, past values of one series do not help forecast future values of the other. This suggests the relationship, if real, is driven by shared contemporaneous market conditions or a common external driver rather than a lead-lag causal mechanism.
3. Notable Patterns and Outliers
The single high-leverage point (162,066, 1,170,416) is doing substantial work in the regression — it is roughly 4x the mean X-value and stands isolated from the main cloud of data. Given the modest sample size (n=252), this one point likely inflates both the slope and r² materially; a robustness check with this point excluded would be essential to determine if the "moderate" correlation is genuine or an artifact of a single extreme day (possibly a market-wide volatility event, e.g., a major news day or year-end trading anomaly, given the Dec 31 dataset boundary). Within the main cluster, the relationship is diffuse and fan-shaped — low-to-mid X values map to a wide range of Y values (300k–700k), suggesting weak local correlation once the outlier is removed. No clear non-linear curvature (log, exponential) is evident from the sample points; the scatter looks broadly linear-noisy rather than curved.
4. Confounding Factors and Caveats
Several caveats limit causal interpretation: - Cross-market comparison: Cboe U.S. equities trade counts and Binance crypto volume are structurally different markets; any correlation is more likely mediated by macro factors (overall market volatility, risk sentiment, calendar effects like month-end/quarter-end rebalancing) than direct mechanistic linkage. - Outlier leverage: With n=252, a single extreme point can shift r and the regression slope substantially — this should be tested via a sensitivity/leave-one-out analysis. - Non-stationarity: Both crypto volume and equity trade counts often exhibit trends, volatility clustering, and seasonality (e.g., increased activity around volatile crypto news events or quarterly equity rebalancing) that can produce spurious correlation without genuine linkage. - No temporal lead-lag (per Granger results) undermines the idea that one market "drives" the other operationally.
5. Suggested Next Steps
1. Re-run correlation and regression excluding the outlier to check if r² collapses — this will clarify whether the relationship is genuine or artifact-driven. 2. Log-transform both variables (common for volume data with skewed distributions) to stabilize variance and re-assess linearity. 3. Investigate the outlier date directly — cross-reference with major market events (e.g., BTC ETF news, equity volatility spikes) to determine if it represents a shared shock rather than a structural relationship. 4. Test for a common confounding variable (e.g., VIX, overall trading-day volatility, or day-of-week/month-end effects) using partial correlation to see if the X-Y link is confounded. 5. Given the null Granger causality result, avoid using one series to forecast the other; instead, treat any observed correlation as coincidental/contemporaneous rather than predictive for trading or risk-modeling purposes.
X dataset: CryptoDataDownload – Binance BTC/USDT Daily OHLCV
Y dataset: Cboe U.S. Equities Historical Market Volume Data 2024
Part of experiment: Bitcoin - CryptoDataDownload – Binance BTC/USDT Daily OHLCV vs Cboe U.S. Equities Historical Market Volume Data 2024