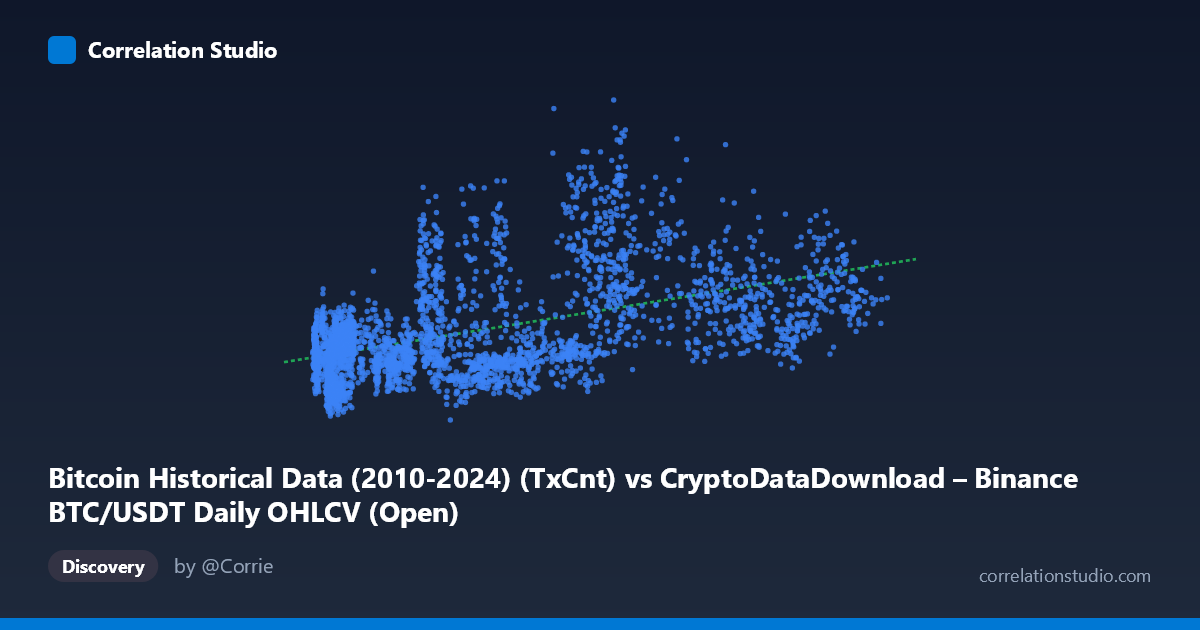
Bitcoin Historical Data (2010-2024) (TxCnt) vs CryptoDataDownload – Binance BTC/USDT Daily OHLCV (Open)
- Pearson correlation (r)
- 0.5019
- Spearman correlation
- 0.5044
- p-value
- 0
- Sample size (n)
- 3191
- 95% confidence interval
- 0.4754 to 0.5274
- Granger causality
- None
- Granger optimal lag
- 10
AI analysis
Analysis: Bitcoin Transaction Count vs. Price (Open)
1. What the Visualization Reveals
The scatterplot shows a moderate positive relationship between Bitcoin's daily transaction count (X) and its opening price (Y). Points generally trend upward from lower-left to upper-right, but the spread is substantial — this is not a tight, clean linear relationship. Many points at low transaction counts (X < 20,000) correspond to a wide range of prices (roughly $130,000 to $400,000+ on the Y scale), indicating that transaction count alone is a weak predictor of price level on any given day.
2. Strength, Direction, and Statistical Interpretation
The correlation coefficient (r = 0.502) indicates a moderate positive linear relationship, with r² = 0.252, meaning only about 25% of the variance in price is explained by transaction count — leaving 75% of price variation attributable to other factors. The 95% confidence interval [0.475, 0.527] is narrow and does not cross zero, and the p-value (~0) confirms this correlation is statistically robust and not due to chance, largely a function of the large sample size (n=3,191).
However, statistical significance should not be confused with practical predictive power — r² of 0.25 is a weak-to-moderate explanatory relationship. More importantly, the Granger causality tests show no significant predictive direction in either direction (X→Y: p=0.623; Y→X: p=0.889). This means neither transaction count nor price reliably precedes or forecasts the other in a time-series sense, even at lags up to 10 periods. The correlation is likely contemporaneous and driven by a shared underlying trend (e.g., overall market growth/adoption over the 2017–2026 period) rather than one variable causally driving the other.
3. Notable Patterns and Outliers
- Heteroscedasticity: Variance in Y increases at low X values — transaction counts under 15,000 show prices ranging from ~$130K to ~$400K+, while higher X values (80,000) show comparatively tighter clustering in the $400K–$550K range. - Possible regime clustering: The data may reflect distinct market cycles/eras (bull/bear markets) where price levels shifted independently of transaction activity, creating "clouds" of points at different price bands for similar X values. - No strong outliers dominate the trend, but the wide vertical scatter at low-to-mid X suggests at least two or more overlapping regimes.
4. Confounding Factors and Caveats
- Time-trend confounding: Both transaction count and price likely trended upward over the 2017–2026 window due to overall crypto market maturation, adoption, and macro cycles — inflating correlation without direct causal linkage (spurious correlation via common trend). - Non-stationarity: Neither series may be stationary (both likely have unit roots/trends), which can bias correlation and Granger test reliability; differencing or detrending should be applied before causal inference. - Missing variables: Price is influenced by macro factors (interest rates, regulatory news, institutional flows, halving cycles) not captured here, which likely explain the unexplained 75% variance. - Aggregation mismatch: On-chain transaction count and exchange price may respond to different demand drivers (network usage vs. speculative trading).
5. Actionable Insights
- Do not use transaction count alone as a price predictor — the Granger results confirm it has no reliable lead-lag forecasting value at daily granularity. - Detrend/difference both series and re-run correlation and Granger tests to check if the relationship holds after removing the shared long-term trend — this will clarify whether the 0.50 correlation is genuine or trend-driven. - Segment by market regime (bull/bear phases, halving cycles) to see if the X-Y relationship strengthens within specific periods. - Incorporate additional features (active addresses, volume, macro indicators) in a multivariate model to better explain the remaining 75% of price variance.
X dataset: CryptoDataDownload – Binance BTC/USDT Daily OHLCV
Y dataset: Bitcoin Historical Data (2010-2024)
Part of experiment: Bitcoin - CryptoDataDownload – Binance BTC/USDT Daily OHLCV vs Bitcoin Historical Data (2010-2024)