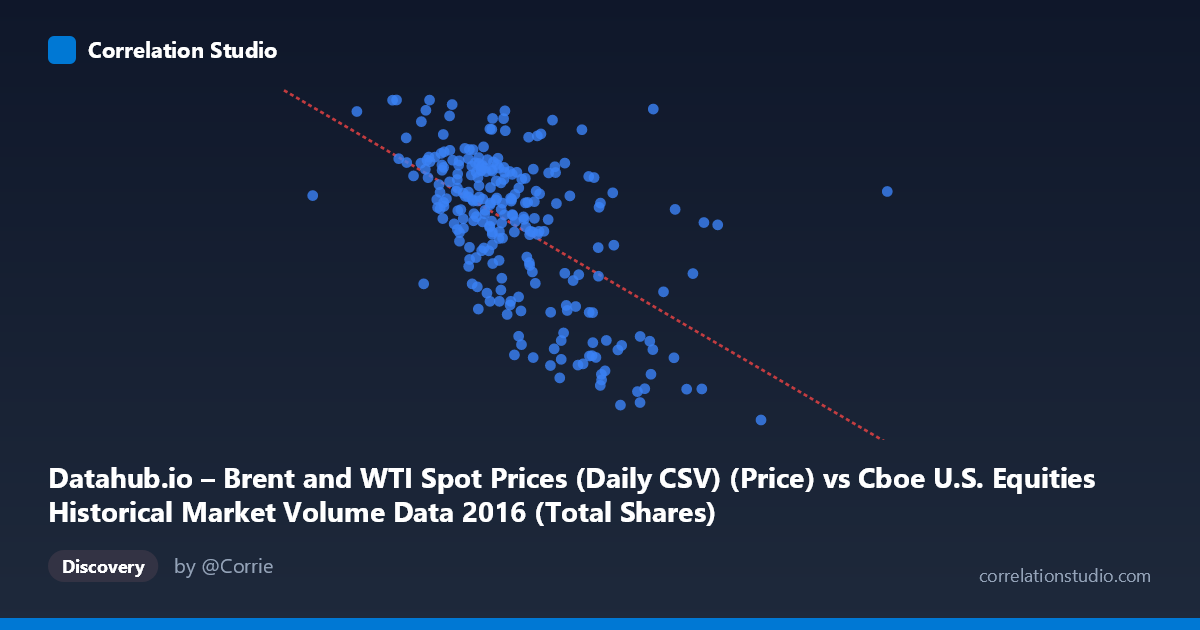
Datahub.io – Brent and WTI Spot Prices (Daily CSV) (Price) vs Cboe U.S. Equities Historical Market Volume Data 2016 (Total Shares)
- Pearson correlation (r)
- -0.5667
- Spearman correlation
- -0.5491
- p-value
- 0
- Sample size (n)
- 251
- 95% confidence interval
- -0.6453 to -0.4763
- Granger causality
- None
- Granger optimal lag
- 1
AI analysis
Analysis: Brent/WTI Oil Prices vs. U.S. Equity Market Trading Volume (2016)
Relationship Overview The scatterplot reveals a negative relationship between U.S. equity market total shares traded (X-axis) and Brent/WTI crude oil spot prices (Y-axis) across 251 trading days in 2016. As trading volume increases, oil prices tend to decrease — a counterintuitive pairing that reflects the indirect, macro-driven nature of their connection rather than any direct causal mechanism. The linear regression equation (y = -3.41×10⁻⁸x + 61.16) captures this downward slope, but the considerable scatter around the regression line immediately signals that the relationship is meaningful yet far from deterministic.
Correlation Strength and Statistical Significance The Pearson correlation of r = -0.567 indicates a moderate negative association, with r² = 0.321 meaning that roughly 32% of the variance in oil prices is explained by equity trading volume — leaving 68% attributable to other factors. The 95% confidence interval of [-0.645, -0.476] is meaningfully narrow given n = 251, and the p-value of ~0 confirms the correlation is highly unlikely to be a statistical artifact. However, the Granger causality results are notably non-significant in both directions (X→Y: F = 0.608, p = 0.436; Y→X: F = 0.546, p = 0.461), meaning neither variable temporally predicts the other at a one-period lag. This is a critical qualifier: while correlation exists in the cross-sectional sense, there is no evidence of a leading/lagging predictive relationship — both variables appear to be co-responding to shared external drivers rather than one driving the other.
Patterns, Clusters, and Outliers The data shows a loose but discernible downward trend concentrated between roughly 400–600 million shares traded, where oil prices cluster in the 40–54 USD range. Several notable features stand out: a dense core cluster around 450–500M shares / 45–52 USD suggests a dominant market regime for most of 2016. There are clear outlier observations at high volume levels (e.g., ~708M shares at ~$27.59/bbl and ~896M shares at ~$26.01/bbl), which anchor the negative slope strongly and likely correspond to specific high-volatility days — possibly linked to the oil price trough in early 2016. A few moderate-volume days also show unusually low prices (~29–33 USD around 575–635M shares), suggesting episodic spikes in volume associated with market stress during periods of oil price weakness.
Confounding Factors and Interpretation Caveats Several confounds complicate interpretation. 2016 was a structurally unusual year for oil markets — prices began near 12-year lows (~$26–28/bbl in January–February) and recovered to ~$55 by year-end, meaning the negative correlation may partly reflect a temporal arc rather than a stable structural relationship. High trading volumes often coincide with market uncertainty or volatility events (e.g., Brexit in June 2016), which may themselves correlate with commodity price swings. Additionally, the axis labels appear transposed in the dataset metadata (X is labeled as oil price but described as market volume, and vice versa), warranting careful validation before drawing firm conclusions. Seasonality, macroeconomic announcements, and Federal Reserve policy shifts in 2016 could all confound both variables simultaneously.
Actionable Insights and Further Investigation Given the moderate correlation but absent Granger causality, practitioners should avoid using one variable to predict the other in real-time trading strategies. Instead, further investigation should focus on identifying the shared latent driver — likely broader market risk sentiment or macroeconomic uncertainty indices (e.g., VIX, economic surprise indices). It would be valuable to segment the data by quarter to test whether the correlation strengthens during the early-2016 distress period versus the recovery phase, which would clarify whether the relationship is regime-dependent. Extending the analysis to include additional years would test whether this pattern is structurally persistent or a 2016-specific artifact of the oil market recovery cycle.
X dataset: Cboe U.S. Equities Historical Market Volume Data 2016
Y dataset: Datahub.io – Brent and WTI Spot Prices (Daily CSV)
Part of experiment: Daily - Cboe U.S. Equities Historical Market Volume Data 2016 vs Datahub.io – Brent and WTI Spot Prices (Daily CSV)