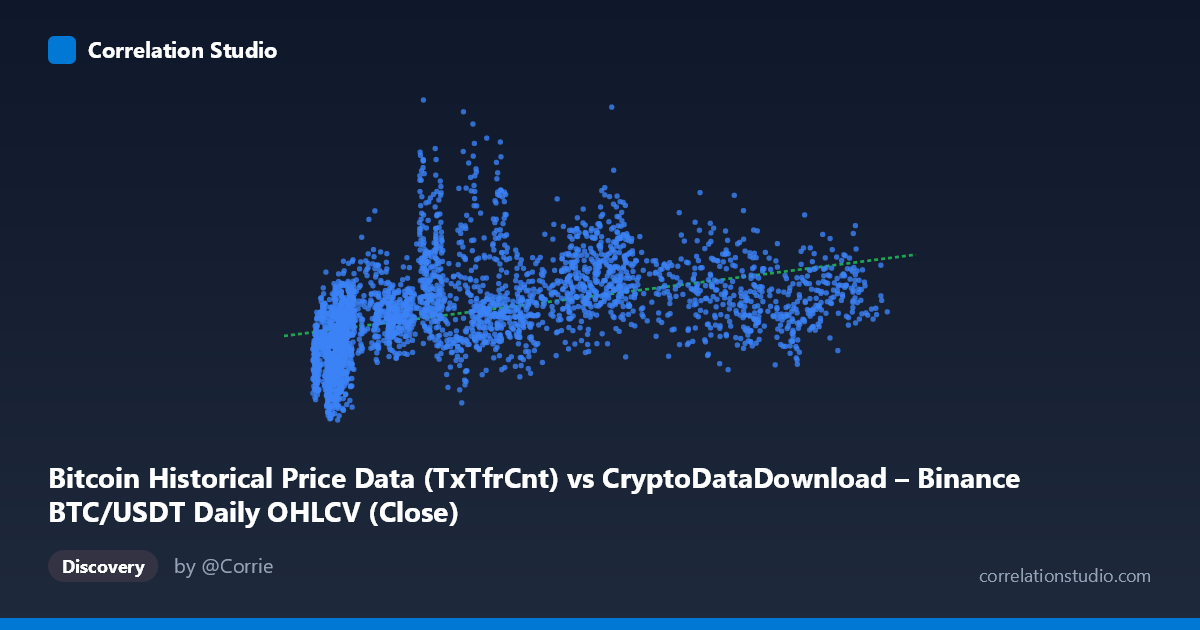
Bitcoin Historical Price Data (TxTfrCnt) vs CryptoDataDownload – Binance BTC/USDT Daily OHLCV (Close)
- Pearson correlation (r)
- 0.4347
- Spearman correlation
- 0.6016
- p-value
- 0
- Sample size (n)
- 3191
- 95% confidence interval
- 0.4061 to 0.4624
- Granger causality
- None
- Granger optimal lag
- 10
- Time coverage
- 2017-08-17 to 2026-05-20
AI analysis
Analysis: Bitcoin Transaction Count vs. Closing Price
1. Relationship Overview
The scatterplot depicts a positive but modest association between Bitcoin's daily on-chain transaction count (TxTfrCnt) and its closing price on Binance. Rather than a clean linear trend, the data forms a dense, cloud-like scatter with substantial vertical dispersion — for any given transaction count, closing prices span a wide range (often 300,000–500,000+ USD). This suggests transaction count is a weak-to-moderate predictor of price on any given day, with many other factors driving price movement independent of network activity.
2. Strength, Direction, and Statistical Confidence
The Pearson correlation (r = 0.435) indicates a moderate positive relationship, but r² = 0.189 reveals that transaction count explains only ~19% of the variance in closing price — leaving over 80% attributable to other factors (market sentiment, macro conditions, liquidity, halving cycles, etc.). The tight confidence interval [0.406, 0.462] combined with p ≈ 0 confirms this correlation is statistically robust and not a product of chance, given the large sample (n=3,191). However, statistical significance here reflects sample size more than practical predictive power — a moderate r² is not strong enough for confident price forecasting from transaction counts alone. Critically, the Granger causality tests show no significant predictive direction in either direction (X→Y: p=0.244; Y→X: p=0.924) even at an optimal lag of 10 periods. This means neither variable "leads" the other in a temporal, forecastable sense — the relationship appears contemporaneous/structural rather than causal-predictive, undermining any strategy that tries to use transaction counts to forecast future price (or vice versa).
3. Patterns and Outliers
The sample points reveal a few notable features: - Low-X, high-Y outliers: Several points with small transaction counts (~9,000–13,000) show surprisingly high prices (~$860,000–$940,000), suggesting periods of low network usage but elevated price — possibly speculative/holding phases rather than active transactional use. - Right-tail compression: High transaction counts (80,000) cluster in a narrower price band (~$830,000–$1,050,000), hinting at a possible ceiling effect or saturation. - Non-linear hint: The note that Spearman ρ exceeds Pearson r suggests the true relationship is monotonic but non-linear — a logarithmic or power-law fit (common in price/volume-type relationships) likely captures the pattern better than a straight line.
4. Confounding Factors and Caveats
Several caveats are important: - Time-series autocorrelation: Both variables are trending time series (price show clear regime shifts across 2017–2026), so correlation may partly reflect shared upward drift over time rather than a direct causal link — a classic spurious correlation risk in financial time series. - Missing lagged/differenced analysis: Raw levels correlation ignores volatility clustering and regime changes (bull/bear markets); using log returns or first differences would give a cleaner picture of genuine co-movement. - External drivers: Regulatory news, macro liquidity (Fed policy), exchange-specific dynamics, and speculative trading volumes are unaccounted for and likely dominate price variance. - Transaction count limitations: On-chain transfer count doesn't capture off-chain/exchange-internal activity, which may better reflect actual trading demand.
5. Recommendations for Further Investigation
- Use log-transformed or differenced series (e.g., % change in tx count vs. % change in price) to test for a more meaningful relationship and reduce spurious trend correlation. - Test non-linear models (log-log, polynomial regression) given the Spearman/Pearson divergence. - Segment by market regime (bull vs. bear vs. sideways) to see if the tx-count/price relationship strengthens or weakens conditionally. - Incorporate additional variables (trading volume, active addresses, exchange inflows/outflows, macro indicators) in a multivariate model, since tx count alone explains <20% of price variance. - Given the lack of Granger causality, avoid using transaction count as a standalone leading indicator for price; it may be more useful as a coincident/confirming metric alongside other signals.
X dataset: CryptoDataDownload – Binance BTC/USDT Daily OHLCV
Y dataset: Bitcoin Historical Price Data
Part of experiment: Bitcoin - CryptoDataDownload – Binance BTC/USDT Daily OHLCV vs Bitcoin Historical Price Data