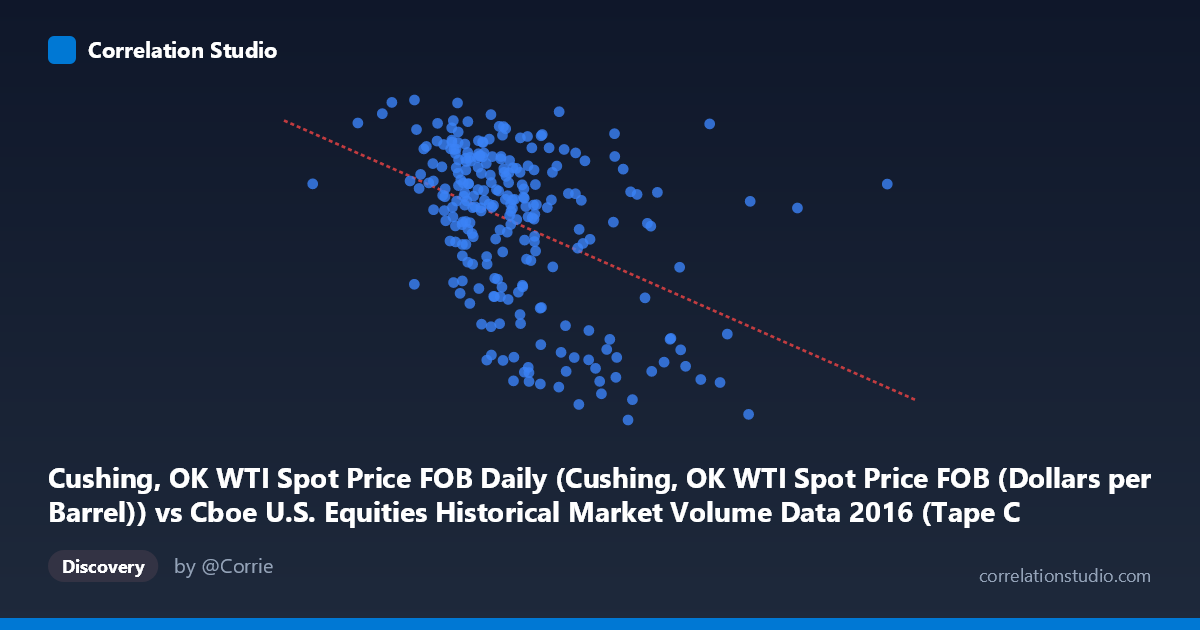
Cushing, OK WTI Spot Price FOB Daily (Cushing, OK WTI Spot Price FOB (Dollars per Barrel)) vs Cboe U.S. Equities Historical Market Volume Data 2016 (Tape C Notional)
- Pearson correlation (r)
- -0.4293
- Spearman correlation
- -0.4228
- p-value
- 0
- Sample size (n)
- 252
- 95% confidence interval
- -0.525 to -0.3228
- Granger causality
- None
- Granger optimal lag
- 1
AI analysis
Analysis: WTI Crude Oil Price vs. Cboe Tape C Notional Volume (2016)
Relationship Overview
The scatterplot reveals a moderate negative relationship between WTI crude oil spot prices (X-axis) and Cboe Tape C notional trading volume (Y-axis) across 252 trading days in 2016. As oil prices increase, Tape C notional volume tends to decline, and conversely, lower oil prices are associated with higher trading volumes. The linear regression equation (y = -2.54×10⁻⁹x + 55.94) captures this downward slope, though the considerable scatter around the regression line immediately signals that this relationship is far from deterministic. The data spans a meaningful range — oil prices from roughly $26 to $54 per barrel and notional volumes from approximately 26 to 54 units — providing adequate dynamic range to observe the trend, yet the cloud-like dispersion suggests many other forces are simultaneously at work.
Correlation Strength, Direction, and Statistical Significance
The Pearson correlation of r = −0.4293 indicates a moderate negative association, but the more sobering figure is r² = 0.1843, meaning WTI price movements explain only about 18.4% of the variance in Tape C notional volume. Roughly 82% of the variation in trading volume is driven by factors entirely unrelated to oil prices. The 95% confidence interval of [−0.5250, −0.3228] is meaningfully bounded away from zero, and the p-value of 1.01×10⁻¹² — vanishingly small — confirms the correlation is highly unlikely to be a statistical artifact given n = 252 paired observations drawn from a population of N = 3,622. Statistically, this is a real and reproducible signal; practically, it is a modest one. Critically, the Granger causality tests yield no significant directional predictive relationship in either direction (X→Y: F = 0.33, p = 0.57; Y→X: F = 0.48, p = 0.49). This means that knowing yesterday's oil price does not meaningfully improve forecasts of today's trading volume, and vice versa — the correlation reflects a contemporaneous co-movement or shared external driver rather than a causal temporal chain between the two series.
Notable Patterns, Clusters, and Outliers
Several structural features stand out in the scatterplot. A dense cluster of points occupies the mid-range oil price zone ($38–$52/barrel) with relatively stable notional volumes (42–50 units), consistent with the calmer second half of 2016 after oil's recovery from its early-year lows. A lower-left sparse region contains points at very low oil prices ($26–$32/barrel) paired with surprisingly low-to-moderate volumes, while a handful of high-volume outliers (volumes above 50) appear at lower oil price levels, suggesting episodic surges in equity trading activity during oil price stress. Points like ($3,469,875,424, 51.44) and ($5,358,087,882, 50.90) sit notably above the regression line, while ($6,246,205,179, 29.55) and ($6,715,100,710, 46.03) suggest that at higher oil prices, volume behavior is also heterogeneous. The relationship appears potentially non-linear, with volume clustering more tightly at intermediate oil prices and showing more dispersion at extremes — worth testing with a quadratic or piecewise fit.
Confounding Factors and Interpretive Caveats
Several important caveats temper interpretation. First, 2016 was an atypical year for both oil markets (recovering from a multi-year price collapse) and equity markets (U.S. election volatility, post-Brexit uncertainty), meaning the correlation may be regime-specific and not generalizable. Second, Tape C notional volume reflects trading in NYSE Arca-listed securities and is influenced by ETF activity, options expiration calendars, index rebalancing, and broad risk-on/risk-off sentiment — forces only loosely connected to oil. Third, the axes appear to have been swapped from their natural labeling (the dataset notes indicate the X-axis source is Cboe volume data while the Y-axis source is the WTI dataset), which warrants verification before drawing directional conclusions. Fourth, macroeconomic confounders — Federal Reserve policy, USD strength, and equity market volatility (VIX) — simultaneously affect both oil prices and trading volumes, making it difficult to attribute co-movement to a direct mechanism without multivariate controls.
Actionable Insights and Further Investigation
Despite the modest explanatory power, the statistically robust negative correlation offers several avenues for practical use and deeper inquiry. Analysts could explore whether energy sector ETFs listed on Tape C (such as XLE or USO) are the primary channel driving the relationship, which would localize the effect rather than implying a broad market-oil link. Given the absence of Granger causality at lag 1, testing longer lags (2–5 trading days) or incorporating implied volatility (VIX, OVX) as a mediating variable could reveal whether the relationship is better characterized as co-movement driven by a common shock. A regime-switching or quantile regression analysis would help determine whether the correlation strengthens at oil price extremes — the scatter suggests it might. Finally, replicating this analysis across multiple years (2014–2020) would clarify whether the 2016 pattern is structural or specific to oil's recovery phase, providing a more robust foundation for any trading or risk-management application.
X dataset: Cboe U.S. Equities Historical Market Volume Data 2016
Y dataset: Cushing, OK WTI Spot Price FOB Daily
Part of experiment: Daily - Cboe U.S. Equities Historical Market Volume Data 2016 vs Cushing, OK WTI Spot Price FOB Daily