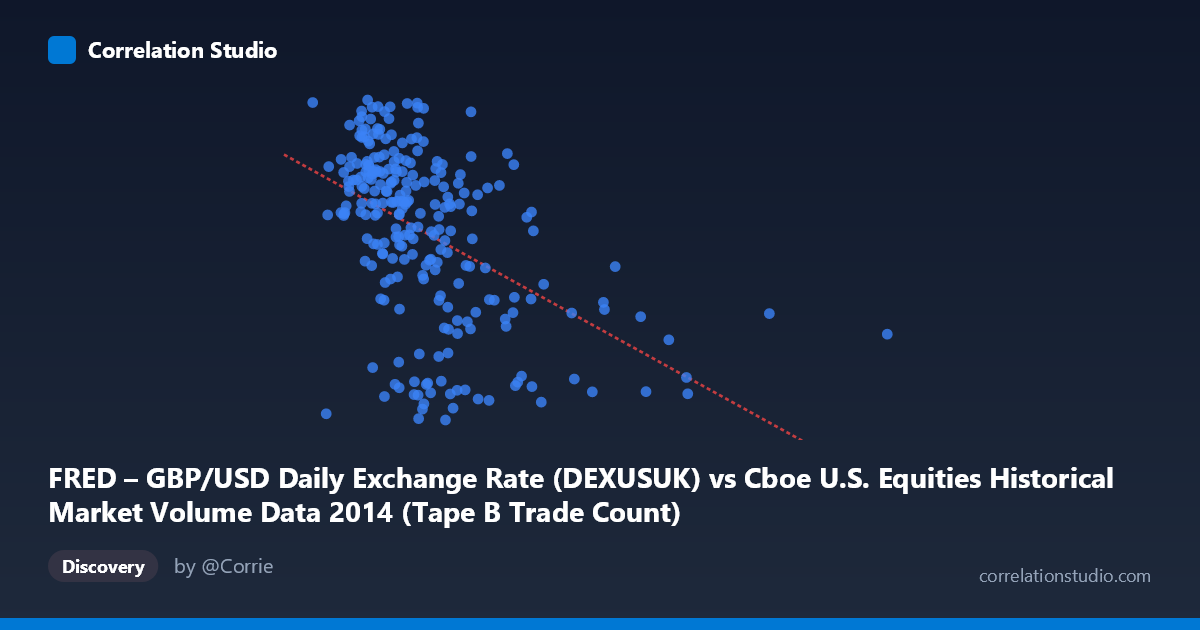
FRED – GBP/USD Daily Exchange Rate (DEXUSUK) vs Cboe U.S. Equities Historical Market Volume Data 2014 (Tape B Trade Count)
- Pearson correlation (r)
- -0.483
- Spearman correlation
- -0.5218
- p-value
- 0
- Sample size (n)
- 249
- 95% confidence interval
- -0.5729 to -0.3816
- Granger causality
- None
- Granger optimal lag
- 1
AI analysis
Analysis: GBP/USD Exchange Rate vs. Cboe Tape B Trade Count (2014)
Relationship Overview The scatterplot reveals a moderate negative relationship between Cboe U.S. Equities market volume (Tape B Trade Count) on the X-axis and the GBP/USD daily exchange rate on the Y-axis across 2014 trading days. As trade counts increase, the pound sterling tends to trade at a lower value against the dollar. The linear regression equation (y = -2.89×10⁻⁷x + 1.712) confirms this downward slope, though the scatter around the regression line is substantial, indicating considerable unexplained variation. Visually, the bulk of observations cluster between roughly 140,000–300,000 trade counts and 1.58–1.71 USD/GBP, with the relationship being clearest within that core range.
Correlation Strength and Statistical Significance The Pearson correlation of r = -0.483 indicates a moderate negative association, and with r² = 0.233, only 23.3% of the variance in GBP/USD is explained by Tape B trade counts — meaning the large majority (76.7%) of exchange rate movement is driven by other forces entirely. The 95% confidence interval of [-0.573, -0.382] is meaningfully negative throughout, suggesting the direction of the relationship is reliable, and the p-value of 6.66×10⁻¹⁶ confirms this association is highly statistically significant given n = 249 paired observations drawn from a population of N = 3,686. However, statistical significance here is partly a function of sample size and should not be conflated with practical or economic importance. Critically, Granger causality tests show no significant predictive direction in either direction (X→Y: F = 0.073, p = 0.787; Y→X: F = 0.002, p = 0.969), meaning neither variable reliably predicts the other in a temporal, lead-lag sense. The correlation is contemporaneous at best and should not be interpreted as causal.
Patterns, Clusters, and Outliers Several features stand out in the data. There is a dense central cluster around 150,000–250,000 trade counts where GBP/USD values span nearly the full observed range (1.57–1.72), suggesting high within-cluster variance that weakens the overall fit. On the right tail, a handful of high-volume days (300,000–675,000+ trade counts) consistently correspond with lower GBP/USD values in the 1.56–1.66 range, which pulls the regression slope downward and may be disproportionately influencing the correlation. The extreme outlier near 675,000 trade counts deserves particular scrutiny — it sits far from the main data cloud and could represent an unusual market event (e.g., an index rebalancing, volatility spike, or data anomaly). The Y-axis range is notably compressed (1.55–1.72), meaning even small absolute changes in GBP/USD appear amplified visually.
Confounding Factors and Caveats The most important caveat is that this correlation is almost certainly spurious or confounded rather than mechanistically meaningful. Both variables are time-series with potential shared exposure to broader 2014 macroeconomic conditions — for example, periods of elevated U.S. equity market volatility (which drives trade volume higher) may coincide with USD strengthening (GBP/USD declining) due to safe-haven flows into dollar assets. This would produce the observed negative correlation without any direct link between Tape B trade counts and sterling valuations. Additionally, seasonal patterns, Federal Reserve policy expectations during 2014 (taper talk, rate hike anticipation), and geopolitical events (Scottish independence referendum in September 2014 notably pressured GBP) could simultaneously affect both series. The dataset covers only a single calendar year, limiting generalizability.
Actionable Insights and Further Investigation Given the failed Granger causality tests, this relationship should not be used for forecasting either variable from the other. However, the contemporaneous correlation warrants further decomposition: researchers should control for VIX or realized volatility to test whether the apparent relationship disappears once market stress is accounted for, which would support the confounding hypothesis. It would also be valuable to extend the time series beyond 2014 to determine whether the negative correlation persists across different currency regimes and market conditions, or whether it is an artifact of a single year's macro environment. Finally, disaggregating by time period within 2014 — particularly isolating the September GBP shock — could reveal whether a small number of event-driven days are responsible for the bulk of the observed correlation.
X dataset: Cboe U.S. Equities Historical Market Volume Data 2014
Y dataset: FRED – GBP/USD Daily Exchange Rate
Part of experiment: Daily - Cboe U.S. Equities Historical Market Volume Data 2014 vs FRED – GBP/USD Daily Exchange Rate