CryptoDataDownload – Gemini BTC/USD Daily OHLCV (open) vs Bitcoin Historical Price USD – All-Time Series (Habrador) (Price)
- Pearson correlation (r)
- 0.9995
- Spearman correlation
- 0.9996
- p-value
- 0
- Sample size (n)
- 3856
- 95% confidence interval
- 0.9995 to 0.9995
- Granger causality
- None
- Granger optimal lag
- 10
- Time coverage
- 2015-10-08 to 2026-04-28
- Recomputed on refreshed data
- 2026-10-22 (r was 0.9995)
AI analysis
Analysis: Bitcoin Price Cross-Reference (Habrador Open vs. Gemini OHLCV)
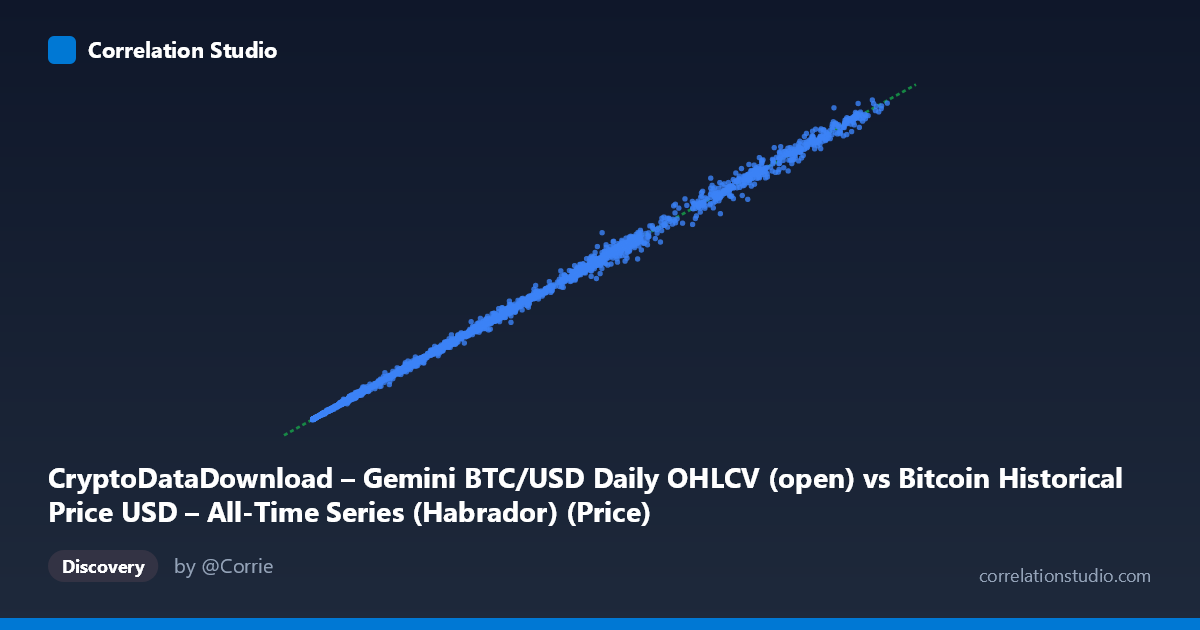
1. What the visualization reveals The scatterplot shows an almost perfectly linear relationship between two Bitcoin price series spanning from ~$243 to ~$124,720. Points trace a tight diagonal line from the origin through the upper-right corner, with virtually no visible scatter at any price level — from sub-$1,000 territory through the $100k+ range. This is the classic signature of two measurements of the same underlying phenomenon rather than two genuinely distinct variables.
2. Strength, direction, and what it actually means With r = 0.9995 and r² = 0.999, the two series share essentially 100% of their variance — the linear regression (y ≈ 0.9987x + 7.9) is a near-identity mapping with a negligible intercept. The 95% CI [0.9995, 0.9995] is razor-thin and the p-value is effectively zero, but given the strength of the relationship and large n, this statistical "significance" is almost a formality — the raw magnitude of r is the real story. Critically, the Granger causality test finds no significant predictive direction in either direction (X→Y p=0.36, Y→X p=0.34). This is expected and important to interpret correctly: it doesn't mean the price series are independent — it means neither series leads the other in time. They move together contemporaneously because they are both reporting the same market price on the same day, not because one drives the other with a lag.
3. Notable patterns and outliers The sampled points confirm the relationship holds uniformly across the entire price range (small values like $452 vs $452 and large values like $118,410 vs $123,383 both sit near the diagonal), indicating no scale-dependent divergence, heteroscedasticity, or breakdown at price extremes. A few sample rows show larger absolute deviations at higher price levels — e.g., (108,530 / 112,571), (78,816 / 84,094), (64,151 / 60,382), (113,700 / 115,388) — suggesting modest exchange-to-exchange spread or timing/reporting differences that scale with price (consistent with proportional rather than fixed-dollar noise, i.e., relative basis-point deviations rather than absolute error).
4. Confounding factors and caveats This is not two independent economic variables correlating — it is two data sources measuring the same asset's price, one being an "open" price from one aggregator and the other Gemini exchange OHLCV data. The near-1:1 relationship is expected and any strong deviation would signal a data quality issue rather than a market phenomenon. Real caveats include: (a) minor exchange-specific spread/liquidity differences (Gemini vs. the broader/composite Habrador series) explaining the small residual scatter; (b) potential timestamp misalignment (open vs. daily aggregate) inflating deviations on volatile days; (c) the Granger test's "no causality" result should not be misread as the series being unrelated — it simply reflects that same-day comovement doesn't produce lagged predictive power; (d) N (4,267) vs n (3,856) indicates ~411 unmatched/missing observations, worth checking for systematic gaps (exchange downtime, missing dates).
5. Actionable next steps Given the near-identity relationship, this pairing is best used as a data validation/reconciliation exercise rather than a causal or predictive study: (1) examine the residuals (y − x) directly, especially on high-volatility days, to quantify exchange spread or lag between Gemini and the composite feed; (2) investigate the ~411 missing/unmatched records for gaps or exchange outages; (3) if the goal is genuine lead-lag/predictive analysis, use finer granularity (intraday) and test against a different exchange or asset rather than a near-duplicate series; (4) treat this pair as a reliable proxy for one another for backtesting purposes, but rely on Gemini-specific data if exchange-level microstructure (slippage, liquidity) matters for the application.
X dataset: Bitcoin Historical Price USD – All-Time Series (Habrador)
Y dataset: CryptoDataDownload – Gemini BTC/USD Daily OHLCV
Part of experiment: Bitcoin - Bitcoin Historical Price USD – All-Time Series (Habrador) vs CryptoDataDownload – Gemini BTC/USD Daily OHLCV