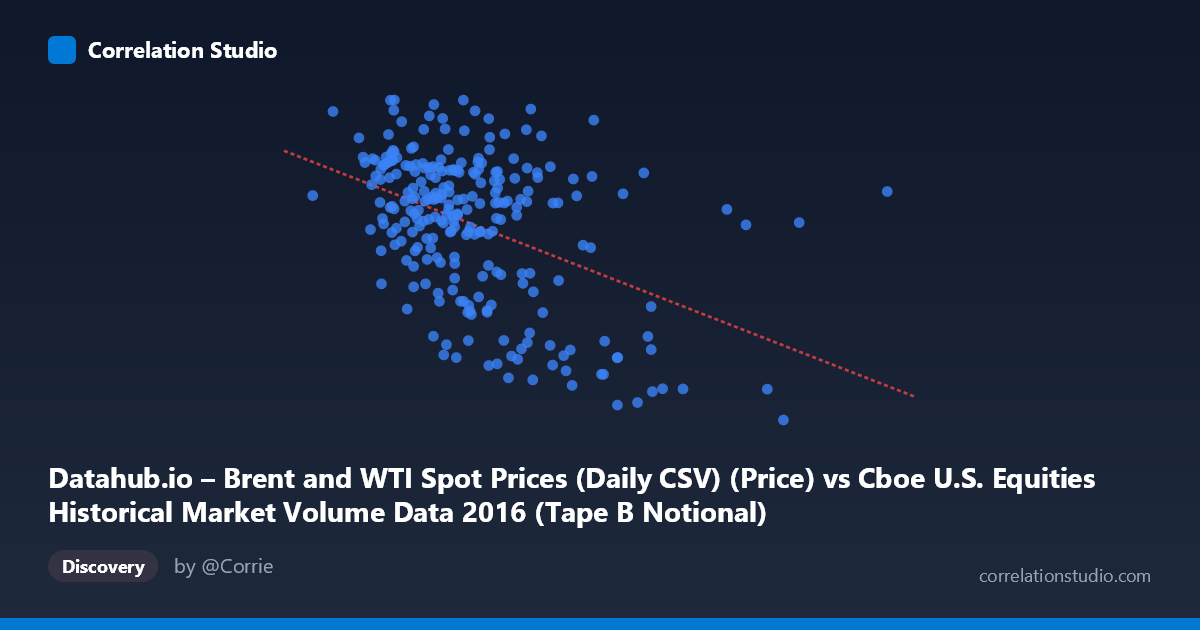
Datahub.io – Brent and WTI Spot Prices (Daily CSV) (Price) vs Cboe U.S. Equities Historical Market Volume Data 2016 (Tape B Notional)
- Pearson correlation (r)
- -0.4436
- Spearman correlation
- -0.3913
- p-value
- 0
- Sample size (n)
- 251
- 95% confidence interval
- -0.5379 to -0.3384
- Granger causality
- None
- Granger optimal lag
- 1
AI analysis
Scatterplot Analysis: Brent Crude Oil Prices vs. Cboe Tape B Notional Volume (2016)
Relationship Overview
The scatterplot reveals a negative relationship between U.S. equities market notional trading volume (Tape B, X-axis) and Brent crude oil spot prices (Y-axis) across 2016. The linear regression equation (y = -1.90×10⁻⁹x + 53.26) confirms that as daily equity market volume increases, oil prices tend to decline. Visually, this manifests as a downward-sloping trend, though with considerable scatter around the regression line. The bulk of observations cluster in the X range of roughly 3–6 billion, with oil prices concentrated between ~40 and 55 USD/barrel, suggesting a relatively normal operating range for both variables during most of 2016.
Correlation Strength and Statistical Significance
The correlation coefficient of r = -0.4436 indicates a moderate negative association, but the explanatory power is modest: r² = 0.197, meaning only about 19.7% of the variance in Brent crude prices is explained by Tape B notional volume. While statistically robust — the p-value of 1.58×10⁻¹³ confirms the result is highly unlikely under the null hypothesis of no correlation, and the 95% CI of [-0.54, -0.34] excludes zero with confidence — practical significance is limited. Over 80% of oil price variance is driven by factors entirely outside this model. Critically, Granger causality tests find no significant predictive directionality in either direction (X→Y: F=0.47, p=0.49; Y→X: F=0.35, p=0.55), meaning neither variable meaningfully predicts the other in subsequent periods. The relationship is contemporaneous at best and should not be interpreted as causal or forecastable.
Notable Patterns, Clusters, and Outliers
Several features stand out in the data. A dense central cluster between ~3.5–5.5 billion in volume and 40–54 USD/barrel dominates the chart, representing typical market conditions. However, there are clear high-volume outliers at the far right of the X-axis — notably points near 8–11 billion in volume — that correspond to markedly low oil prices (26–32 USD/barrel). These extreme observations, including the point at approximately (10.8B, 26.01) and (8.1B, 27.59), exert significant leverage on the regression slope and likely account for a disproportionate share of the observed correlation. Conversely, one point near (3.7B, 53.01) represents relatively high oil prices at moderate volume. The relationship also appears potentially non-linear — the mid-range of X shows considerable vertical spread with no strong pattern, while the correlation appears driven primarily by the outlier high-volume days.
Confounding Factors and Caveats
Several important caveats apply. First, 2016 was an unusual year for both variables: Brent crude began the year near historic lows (~$27) amid a global supply glut and recovered to ~$55 by year-end following the OPEC production agreement in November — creating a strong temporal trend in Y that may be confounding the volume relationship. High equity market volume days often correspond to volatility events (e.g., early 2016 market turbulence, Brexit in June, U.S. election in November), and these same macro shocks independently suppressed or influenced oil prices. Additionally, Tape B notional value captures a specific subset of U.S. equities trading (NYSE American and regional exchanges), which may not represent overall market sentiment as broadly as a composite volume measure. The dataset labels also appear swapped in description (X is labeled from the Brent dataset source, Y from the Cboe source), suggesting potential metadata inconsistency worth verifying before drawing conclusions.
Actionable Insights and Further Investigation
Despite limited explanatory power, this relationship warrants targeted follow-up. Investigators should control for the temporal trend in oil prices by detrending or segmenting the analysis into pre- and post-OPEC agreement periods to determine whether the correlation persists independently of the secular recovery in crude prices. Incorporating broader market volume metrics (total U.S. equity notional, VIX, or S&P 500 returns) alongside oil prices would help isolate whether volume-oil linkages reflect genuine risk-appetite dynamics or are artifacts of shared macro drivers. Given that the extreme high-volume outliers appear central to the correlation, a robust regression or outlier-exclusion sensitivity analysis is strongly recommended. Finally, while Granger causality finds no lag-1 predictive relationship, testing higher-order lags or intraday data may reveal more nuanced short-term dynamics between energy market sentiment and equity trading activity.
X dataset: Cboe U.S. Equities Historical Market Volume Data 2016
Y dataset: Datahub.io – Brent and WTI Spot Prices (Daily CSV)
Part of experiment: Daily - Cboe U.S. Equities Historical Market Volume Data 2016 vs Datahub.io – Brent and WTI Spot Prices (Daily CSV)