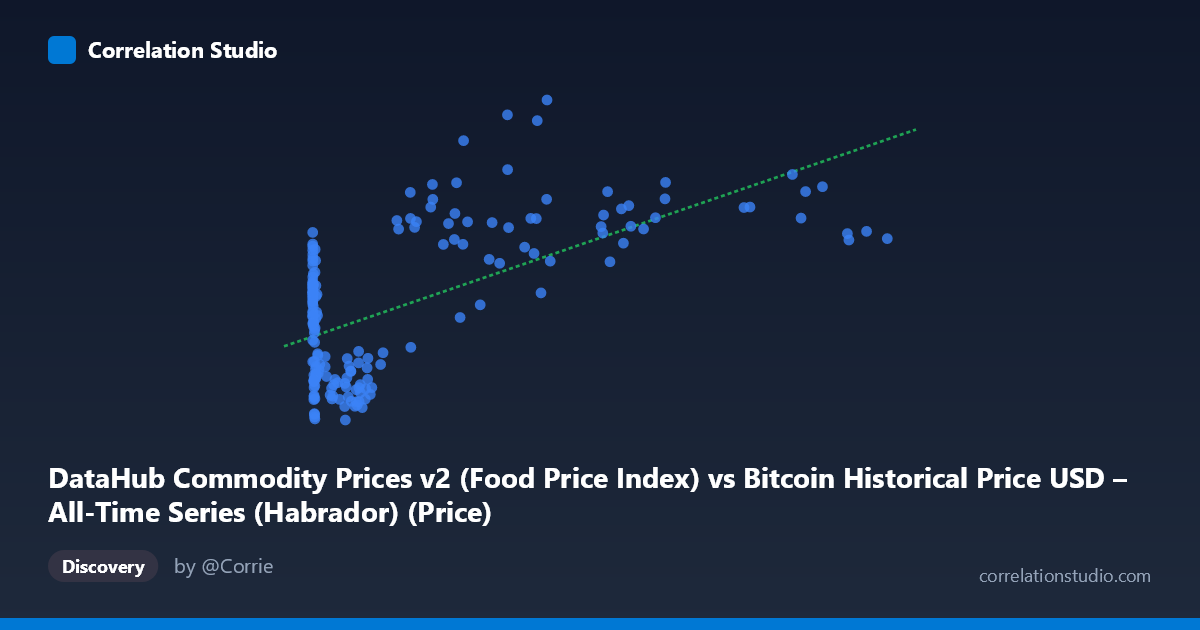
DataHub Commodity Prices v2 (Food Price Index) vs Bitcoin Historical Price USD – All-Time Series (Habrador) (Price)
- Pearson correlation (r)
- 0.6221
- Spearman correlation
- 0.4054
- p-value
- 0
- Sample size (n)
- 182
- 95% confidence interval
- 0.5241 to 0.7039
- Granger causality
- None
- Granger optimal lag
- 1
- Time coverage
- 2010-08-01 to 2025-09-01
- Recomputed on refreshed data
- 2026-10-24 (r was 0.6221)
AI analysis
Analysis: Bitcoin Price vs. Food Price Index
1. Relationship Overview
The scatterplot displays a moderate positive association between Bitcoin's historical USD price (X-axis, spanning an enormous range from $0.06 to $113,500) and the Food Price Index (Y-axis, ranging narrowly from 92.14 to 162.30). The relationship is clearly non-linear in raw form due to Bitcoin's exponential growth pattern, though the linear fit captures a meaningful trend: as Bitcoin's price increases across its historical trajectory, the Food Price Index also tends to rise, particularly once Bitcoin moves beyond the sub-$1,000 range.
2. Strength, Direction, and Statistical Confidence
The correlation coefficient (r = 0.622) indicates a moderate-to-strong positive relationship, with r² = 0.387 meaning roughly 39% of the variance in the Food Price Index is statistically associated with Bitcoin's price level — leaving 61% unexplained by this single variable. The 95% confidence interval [0.524, 0.704] is reasonably tight and does not cross zero, and the p-value of effectively 0 confirms this correlation is highly unlikely to be due to chance alone in this sample. However, the Granger causality tests are critical here: neither direction shows significant predictive power (X→Y: p=0.40; Y→X: p=0.92). This strongly suggests the correlation is not causal in a temporal, lead-lag sense — Bitcoin price does not help predict future Food Price Index values, nor vice versa. This is a classic case of contemporaneous correlation without predictive causality, likely both variables are independently trending upward over the 2010–2025 period.
3. Notable Patterns and Outliers
Several structural features stand out: - Compression at low X values: The vast majority of Bitcoin's price history is compressed near zero on this scale (values under $1,000 for early years), while Y values in that region show substantial spread (92–130), indicating high noise/low signal at low Bitcoin prices. - Fan-out at high X values: As Bitcoin exceeds $20,000, Food Price Index values cluster in a higher band (117–162), but with considerable scatter — e.g., at similar Bitcoin prices (~$28,000–$46,000), Food Index values range widely from ~117 to ~162. - Potential outliers: Points like (33087.37, 117.39) and (45092.81, 120.00) sit noticeably below the trend for their X-range, while (44354.64, 157.77) and (38469.09, 159.04) sit well above — suggesting the relationship is heavily time-dependent rather than price-dependent. - The extreme right-skew of X (mean 17,943 vs. median likely much lower, stdev 27,080) means a handful of high-Bitcoin-price observations exert disproportionate leverage on the regression line.
4. Confounding Factors and Caveats
This is very likely a spurious correlation driven by shared time trends rather than genuine economic linkage: - Both series have risen substantially over 2010–2025 due to independent macro factors (Bitcoin: adoption/speculation cycles; Food Index: inflation, supply chains, geopolitical events like COVID-19 and the Ukraine war). - Non-stationarity in both time series is a major concern — the Granger test's failure to find directional causality after differencing/lagging supports this: the raw correlation is likely an artifact of two upward-trending series over time, not a genuine dynamic relationship. - The massive scale disparity in X (0.06 to 113,500) means log-transformation was likely needed for a meaningful linear relationship; the linear R² may be inflated by leverage points at extreme X values. - No plausible direct economic mechanism links Bitcoin price to global food prices at monthly resolution.
5. Actionable Insights
- Do not treat this as a tradeable or predictive relationship — the Granger results explicitly rule out using Bitcoin price to forecast food prices or vice versa. - Re-run analysis on log(Bitcoin price) rather than raw price, and consider detrending both series (e.g., first-differencing or removing time trend) before assessing correlation — this will likely reveal whether any relationship persists beyond shared upward drift. - Investigate a common third factor, such as USD inflation/monetary expansion or global liquidity conditions, which could simultaneously drive both crypto speculation and commodity prices. - Consider time-segmented analysis (e.g., pre/post-2020) to check if the relationship is stable or driven by specific periods like the 2020–2022 inflation surge.
X dataset: Bitcoin Historical Price USD – All-Time Series (Habrador)
Y dataset: DataHub Commodity Prices v2
Part of experiment: Bitcoin - Bitcoin Historical Price USD – All-Time Series (Habrador) vs DataHub Commodity Prices v2