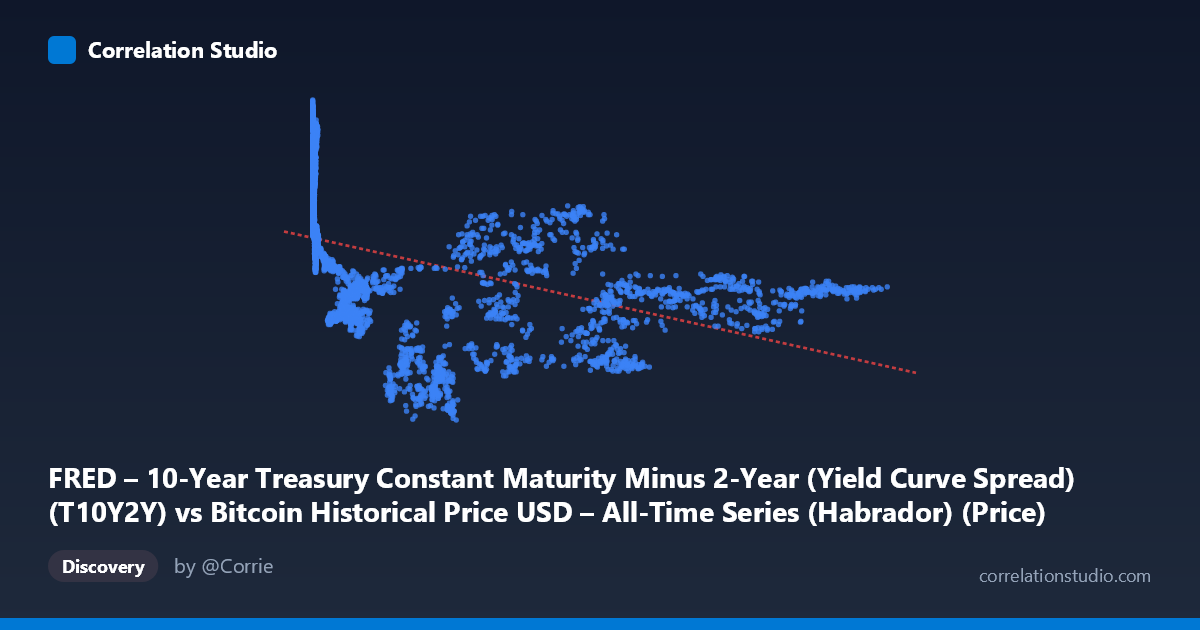
FRED – 10-Year Treasury Constant Maturity Minus 2-Year (Yield Curve Spread) (T10Y2Y) vs Bitcoin Historical Price USD – All-Time Series (Habrador) (Price)
- Pearson correlation (r)
- -0.443
- Spearman correlation
- -0.7279
- p-value
- 0
- Sample size (n)
- 4042
- 95% confidence interval
- -0.4675 to -0.4179
- Granger causality
- None
- Granger optimal lag
- 1
- Time coverage
- 2010-07-19 to 2026-09-15
- Recomputed on refreshed data
- 2026-10-24 (r was -0.4375)
AI analysis
Analysis: Bitcoin Price vs. Yield Curve Spread (T10Y2Y)
Note on axis labeling: The metadata appears swapped — the sample points show values like 124,720 paired with values in the [-1.08, 2.91] range, indicating X is actually Bitcoin price (USD, heavily right-skewed with mean ~$20,782 but reaching six figures) and Y is the T10Y2Y spread (a bounded oscillator typically between -1 and 3). The analysis below treats the data as presented in the summary.
1. What the Scatterplot Reveals The chart shows a downward-sloping but noisy cloud: as Bitcoin's price climbs into the tens of thousands of dollars, the yield curve spread compresses and frequently turns negative (inversion). At low Bitcoin prices (<$1,000, corresponding to 2010–2016), the spread clusters high and positive (1.5–2.9). As price rises into the $30K–$125K range, spread values scatter widely from -1.08 to +1.35, showing much more heterogeneity than the low-price regime.
2. Strength, Direction, and Statistical Confidence The correlation is moderate and negative (r = -0.4375), with r² indicating only ~19% of the variance in the spread is explained by Bitcoin price — meaning 81% of the variation is driven by other factors. The tight 95% CI [-0.4624, -0.4119] and p≈0 confirm this relationship is statistically robust and not due to chance, but statistical significance here reflects the large sample size (n=3,946) rather than practical predictive strength. Critically, Granger causality tests show no significant lead-lag relationship in either direction (Bitcoin→Spread p=0.37; Spread→Bitcoin p=0.10). This means neither series reliably predicts the other's future values — the correlation is likely coincidental co-trending (both reflect the same macro backdrop, e.g., 2010s low-rate era coinciding with early Bitcoin adoption) rather than a causal or forecastable dynamic.
3. Notable Patterns and Non-linearity The data show a threshold/regime-shift pattern rather than a smooth linear decline: spread values stay elevated (~1.5–2.9) while Bitcoin is below ~$1,000, then drop and scatter widely once price exceeds $5,000. This is more consistent with two distinct time regimes (pre-2018 rate environment vs. post-2018 rate environment) than a continuous functional relationship. The note that Spearman ρ exceeds Pearson r supports a non-linear or monotonic-but-curved relationship — likely a logarithmic decay (spread drops sharply then plateaus) or a step function tied to Fed policy cycles rather than Bitcoin price itself.
4. Confounding Factors and Caveats This is a classic spurious correlation risk: both variables are strongly time-trending. Bitcoin price has grown many orders of magnitude over 2010–2026, while the yield curve spread follows its own multi-year Fed policy cycle (QE, rate hikes, inversions in 2019 and 2022–2023). The apparent relationship is more plausibly explained by shared exposure to calendar time and macro regime (e.g., 2022 rate hikes causing inversion while Bitcoin also sold off from its 2021 peak) than by any economic mechanism linking Treasury yields to crypto valuations directly. The right-skewed X distribution (mean $20,781, stdev $30,315) means a few large-price/negative-spread points (the 2022 inversion + BTC drawdown) could disproportionately influence the linear fit.
5. Suggested Next Steps - Detrend or difference both series (e.g., use % change or log-returns) before correlating, to remove the shared time-trend artifact and test for genuine co-movement. - Segment by macro regime/year to check whether the correlation is driven entirely by 2022 (rate hikes + crypto winter) rather than a persistent relationship. - Since Granger causality is absent, avoid using either series as a forecasting input for the other; instead explore common third factors (Fed funds rate, real yields, DXY, liquidity/M2) that may jointly drive both. - Fit a non-linear model (log or piecewise) given the Spearman/Pearson divergence, and report r² from that specification for a fairer strength assessment.
X dataset: Bitcoin Historical Price USD – All-Time Series (Habrador)
Y dataset: FRED – 10-Year Treasury Constant Maturity Minus 2-Year (Yield Curve Spread)
Part of experiment: Bitcoin - Bitcoin Historical Price USD – All-Time Series (Habrador) vs FRED – 10-Year Treasury Constant Maturity Minus 2-Year (Yield Curve Spread)