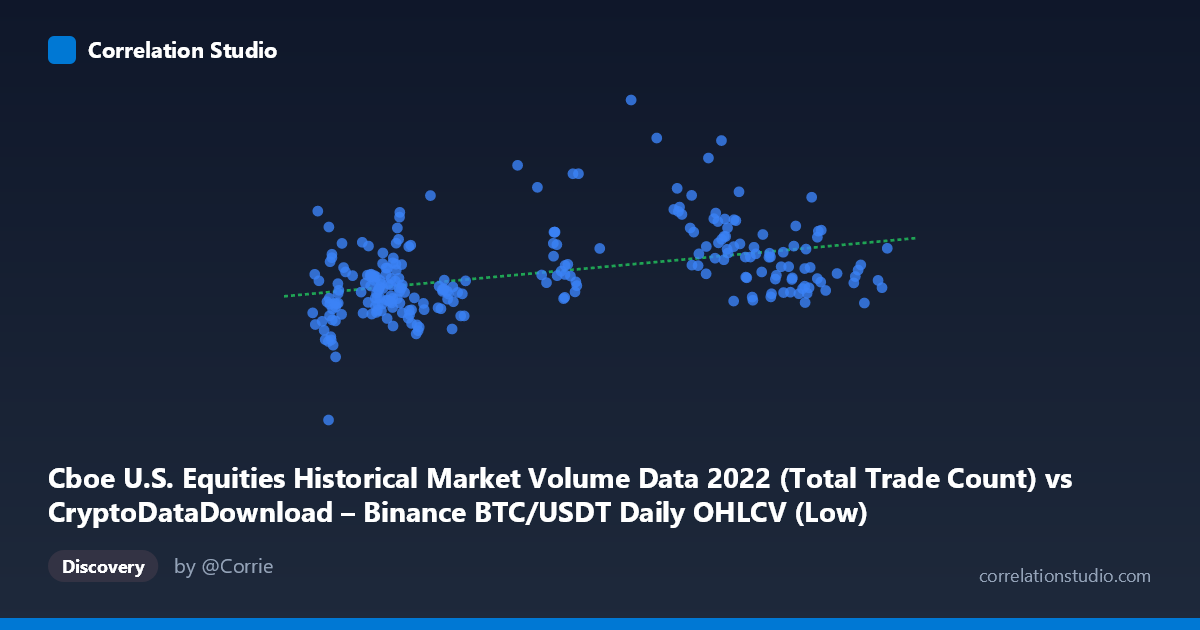
Cboe U.S. Equities Historical Market Volume Data 2022 (Total Trade Count) vs CryptoDataDownload – Binance BTC/USDT Daily OHLCV (Low)
- Pearson correlation (r)
- 0.4183
- Spearman correlation
- 0.4282
- p-value
- 0
- Sample size (n)
- 251
- 95% confidence interval
- 0.3106 to 0.5155
- Granger causality
- None
- Granger optimal lag
- 10
- Time coverage
- 2022-01-03 to 2022-12-30
AI analysis
Analysis: Cboe Equities Trade Count vs. Binance BTC/USDT Daily Low
1. What the Visualization Reveals
The scatterplot shows a weak-to-moderate positive relationship between U.S. equities market trade counts (X) and Bitcoin's daily low price (Y) throughout 2022. Points are widely scattered around the regression line, with substantial vertical spread at nearly every X value — indicating that trade count alone provides limited explanatory power for BTC price levels. The data shows two loose clusters: a lower-X group (~16,000–23,000 trades) with BTC lows mostly in the $3.2M–$4.2M range (note: likely a data scaling artifact, as BTC lows in the millions suggest unit mismatch or possible satoshi/notional scaling), and a higher-X group (~35,000–46,000) with more variable and often higher Y values.
2. Strength, Direction, and Uncertainty
The correlation coefficient (r = 0.418) indicates a modest positive linear relationship, with r² = 0.175 meaning only 17.5% of the variance in BTC's daily low is explained by equity trade counts — leaving over 82% attributable to other factors. The 95% CI [0.311, 0.516] is reasonably tight and excludes zero, and the p-value (4.7×10⁻¹²) confirms this correlation is highly statistically significant given n=251. However, statistical significance here reflects sample size and consistency, not practical predictive strength — the relationship is real but weak. Critically, the Granger causality tests show no significant predictive direction in either direction (X→Y: p=0.66; Y→X: p=0.32), meaning past values of one series do not meaningfully forecast future values of the other. This suggests the correlation is likely driven by shared exposure to common macro conditions (e.g., 2022's synchronized risk-off environment) rather than any lead-lag causal mechanism.
3. Notable Patterns and Outliers
Several high-Y outliers stand out — points like (26700, 5965975), (37867, 6397686), and (27785, 5582093) sit well above the main cluster, likely corresponding to early-2022 dates before BTC's sustained decline. These appear to pull the regression line upward and may disproportionately influence the r² estimate. The bulk of observations with X < 25,000 cluster tightly in a lower Y band, while higher-X observations show much greater dispersion — suggesting heteroskedasticity (non-constant variance) rather than a clean linear trend. This fan-shaped spread implies a linear model may be misspecified for portions of the data.
4. Confounding Factors and Caveats
Both series are non-stationary daily financial time series from 2022 — a year marked by a secular BTC downtrend and equity volatility (Fed tightening, macro risk-off). Such shared temporal trends can produce spurious correlation independent of any real relationship, since both variables may simply be trending together due to common macro drivers (interest rates, risk sentiment, liquidity conditions) rather than direct interaction. Additionally, comparing "trade count" (a volume/activity metric) to "price low" (a price-level metric) is an unusual pairing — differencing or using returns instead of levels would likely reveal whether any relationship survives detrending.
5. Suggestions for Further Investigation
Given the non-stationarity concern, analysts should re-run this analysis on differenced or log-return series rather than raw levels to check whether the r²=0.175 relationship persists or vanishes (a strong indicator of spurious correlation if it disappears). Additionally, verify the Y-axis units/scale, as "daily low" values in the millions are inconsistent with actual BTC/USDT prices in 2022 (~$16K–$48K), suggesting a data processing or column-mapping error that should be corrected before drawing further conclusions. Finally, given the null Granger causality result, any trading or forecasting strategy assuming lead-lag dynamics between equity volume and BTC price would be unsupported by this data.
X dataset: CryptoDataDownload – Binance BTC/USDT Daily OHLCV
Y dataset: Cboe U.S. Equities Historical Market Volume Data 2022
Part of experiment: Bitcoin - CryptoDataDownload – Binance BTC/USDT Daily OHLCV vs Cboe U.S. Equities Historical Market Volume Data 2022