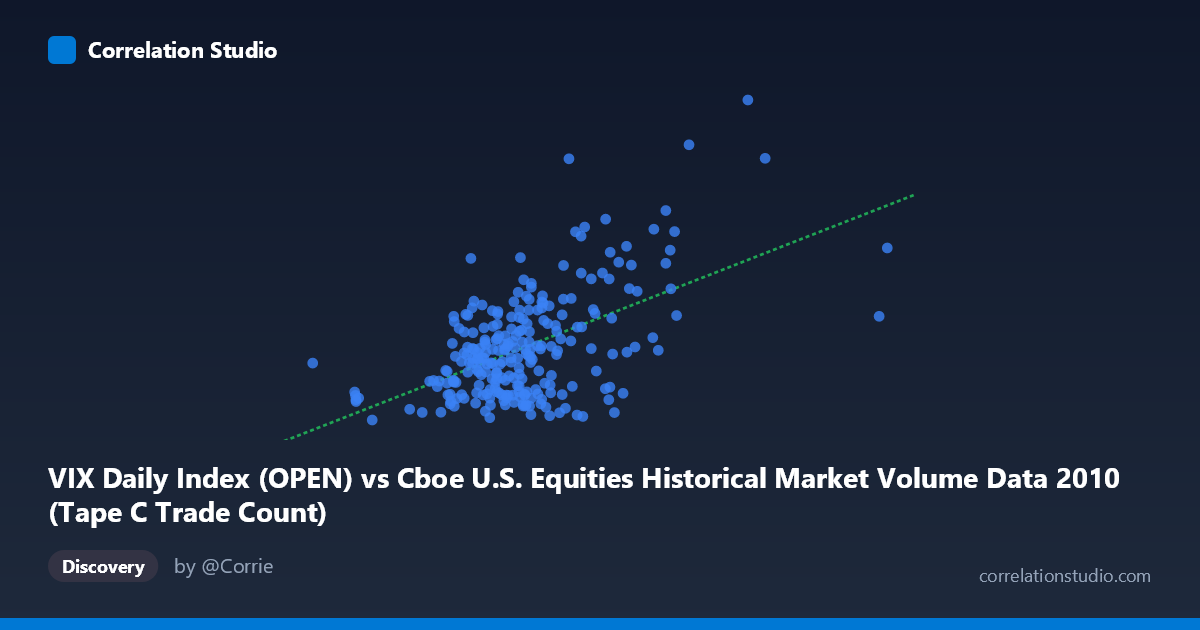
VIX Daily Index (OPEN) vs Cboe U.S. Equities Historical Market Volume Data 2010 (Tape C Trade Count)
- Pearson correlation (r)
- 0.5377
- Spearman correlation
- 0.3963
- p-value
- 0
- Sample size (n)
- 252
- 95% confidence interval
- 0.4436 to 0.6201
- Granger causality
- Y → X
- Granger optimal lag
- 1
AI analysis
Analysis: VIX Open vs. Tape C Trade Count (2010)
Relationship Overview The scatterplot reveals a moderate positive relationship between the Cboe VIX Daily Index (Open) on the x-axis and Tape C Trade Count on the y-axis across 252 trading days in 2010. As market volume (measured by VIX open values) increases, trade counts tend to rise as well, though with considerable scatter around the trend line. The linear regression equation (y = 1.87×10⁻⁵x + 11.19) indicates a shallow but meaningful slope, suggesting that higher VIX-associated volume levels are associated with incrementally more trades on Tape C venues. Visually, the bulk of observations cluster in the lower-left portion of the chart, with a rightward and upward tail of more extreme values.
Correlation Strength and Statistical Framing The Pearson correlation of r = 0.5377 reflects a moderate positive association, but the more informative metric is R² = 0.2892 — meaning only ~29% of the variance in Tape C Trade Count is explained by VIX Open volume levels. The remaining ~71% is attributable to other factors entirely. The 95% confidence interval [0.4436, 0.6201] is reasonably tight given the sample size of n=252 drawn from a population of N=3,302, and the p-value of effectively 0 confirms this correlation is statistically robust and unlikely due to chance. Critically, the Granger causality analysis reveals a unidirectional temporal relationship: Y Granger-causes X (F=5.60, p=0.019), meaning past Tape C Trade Count values carry statistically significant predictive information about future VIX volume levels — but not vice versa (X→Y: F=1.54, p=0.215). This is a notable asymmetry: trade activity appears to lead volume, not follow it.
Notable Patterns, Clusters, and Outliers Several features stand out in the data. The majority of points form a dense cluster roughly between x=430,000–700,000 and y=16–28, suggesting a stable baseline regime for most of 2010. However, there are clear high-leverage outliers in the upper-right quadrant — most notably the points near (1,086,790, 47.66) and (963,255, 43.15), which likely correspond to specific high-volatility market events. The point at (1,379,287, 32.76) represents the maximum x-value but a comparatively moderate y-value, hinting at non-linearity: extremely high volume does not always correspond to proportionally high trade counts. Similarly, the lower-left outlier near (298,429, 15.44) anchors the low end. These extremes disproportionately influence the regression slope and inflate the apparent correlation strength.
Confounding Factors and Caveats Several important caveats apply. First, axis labeling appears inverted relative to typical interpretations — VIX is a volatility index, not directly a volume measure, and Tape C Trade Count originates from the volume dataset rather than the VIX dataset; this metadata inconsistency warrants verification before drawing firm conclusions. Second, the Granger causality result, while statistically significant at lag=1, does not imply economic causation — both variables may be jointly driven by common market shocks (e.g., flash crash events, Fed announcements, earnings seasons) that simultaneously spike volatility and trading activity. Third, 2010 was an atypical year including the May 6 Flash Crash, which could artificially strengthen the observed correlation through a handful of extreme co-movement events. Finally, daily data aggregation masks intraday dynamics that might reveal a more nuanced or weaker relationship.
Actionable Insights and Further Investigation Practitioners should not rely on VIX open levels alone to forecast Tape C trade activity, given that 71% of variance remains unexplained. However, the Granger result suggests a potentially useful trading signal: monitoring Tape C trade count changes today may provide a 1-period-ahead edge in anticipating VIX-linked volume shifts. Recommended next steps include: (1) removing or flagging Flash Crash-period observations to test whether the correlation holds in calmer regimes; (2) fitting a non-linear or piecewise model to capture the apparent threshold behavior at high volume levels; (3) incorporating additional covariates such as S&P 500 returns, bid-ask spreads, or options market activity to build a more complete explanatory model; and (4) replicating this analysis across multiple years to assess whether the Granger relationship is structurally stable or an artifact of 2010's unique market conditions.
X dataset: Cboe U.S. Equities Historical Market Volume Data 2010
Y dataset: VIX Daily Index
Part of experiment: Daily - Cboe U.S. Equities Historical Market Volume Data 2010 vs VIX Daily Index