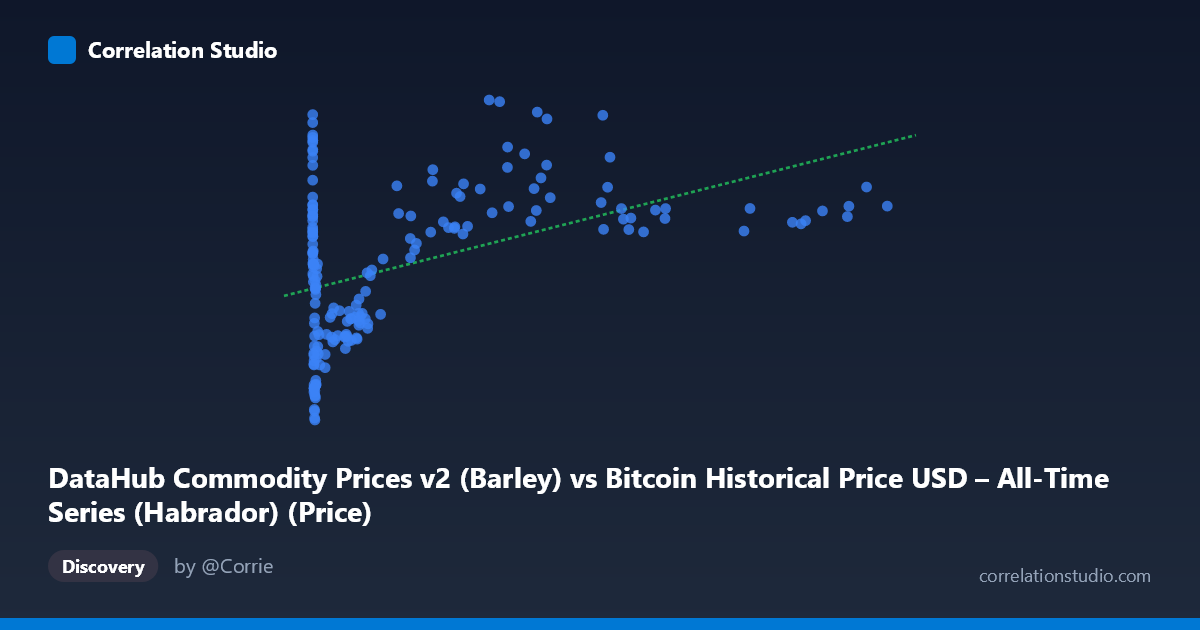
DataHub Commodity Prices v2 (Barley) vs Bitcoin Historical Price USD – All-Time Series (Habrador) (Price)
- Pearson correlation (r)
- 0.4557
- Spearman correlation
- 0.2586
- p-value
- 0
- Sample size (n)
- 182
- 95% confidence interval
- 0.3322 to 0.5638
- Granger causality
- None
- Granger optimal lag
- 2
AI analysis
Analysis: Bitcoin Price vs. Barley Commodity Price
1. What the Visualization Reveals
The scatterplot shows a positive but noisy relationship between Bitcoin's historical USD price (X-axis) and barley commodity prices (Y-axis). The data spans an enormous range on the X-axis (from $0.06 to $113,500), reflecting Bitcoin's extraordinary price growth from its genesis through recent cycles, while barley prices move within a comparatively narrow band ($85–$235). This scale disparity means the relationship is dominated by a handful of high-Bitcoin-price observations, while the vast majority of points cluster at low X-values (early Bitcoin history) with substantial Y-axis scatter.
2. Strength, Direction, and Statistical Interpretation
The correlation coefficient (r = 0.456) indicates a moderate positive relationship, but r² = 0.208 tells the more important story: only about 21% of the variance in barley prices is explained by Bitcoin price (or vice versa) — leaving nearly 80% unexplained by this linear relationship. The 95% CI [0.332, 0.564] is reasonably tight and excludes zero, and the p-value (1.02E-10) confirms this correlation is highly statistically significant — it's very unlikely to be due to chance. However, statistical significance does not imply practical strength: this is a weak-to-moderate relationship, not one suitable for predictive modeling in isolation. Critically, the Granger causality tests show no significant predictive direction in either direction (X→Y: p=0.513; Y→X: p=0.765). This means neither variable's past values help forecast the other's future values — the correlation is likely coincidental co-movement (e.g., both trending upward over the same calendar period) rather than a causal or lead-lag relationship.
3. Notable Patterns and Outliers
The data shows a non-linear, heteroscedastic pattern: at low Bitcoin prices (X < 1000), barley prices vary wildly (from ~86 to ~217), showing essentially no relationship in this region. As Bitcoin prices increase into the tens of thousands, barley prices trend upward more consistently (e.g., pairs like 44354→228.88, 46208→204.13, 58724→207.81), suggesting the correlation is driven largely by the shared time trend — both series were likely rising over the 2010–2025 window rather than one driving the other. There's also a notable outlier cluster at very low X-values (X < 1) with high Y-values (185–217), representing Bitcoin's earliest days coinciding with elevated barley prices — likely an artifact of the 2010-2011 agricultural commodity spike, unrelated to Bitcoin.
4. Confounding Factors and Caveats
This pairing is a classic case of spurious correlation risk. Both series span 2010–2025 and each independently exhibits strong secular trends (Bitcoin's exponential rise; barley's inflation-driven and supply/demand-driven price cycles). Common macroeconomic drivers — inflation, USD strength/weakness, global monetary policy (especially post-2020 stimulus), and broad "risk-on" investor sentiment — could inflate both series simultaneously without any direct economic link between crypto markets and grain markets. The extreme scale skew in X (log-normal-like distribution) also means standard Pearson correlation may be distorted by a few extreme high-Bitcoin-price points exerting outsized leverage on the regression line.
5. Actionable Insights
Given the lack of Granger causality and modest r², this correlation should not be used for forecasting or trading strategies linking Bitcoin and barley prices. Further investigation should: (a) test for spurious correlation by detrending both series (e.g., using differenced or log-differenced values) and re-running the correlation; (b) control for shared macro factors like CPI/inflation indices or USD index; (c) apply a log transform to Bitcoin price given its exponential growth, which may reveal a different relationship shape; and (d) examine whether the correlation holds within specific sub-periods (e.g., 2020-2022 supply chain/inflation shock) versus washing out in stable periods. If aiming to explain barley price movements, agricultural supply/demand fundamentals (weather, planting acreage, export policy) are far more likely candidates than Bitcoin price action.
X dataset: Bitcoin Historical Price USD – All-Time Series (Habrador)
Y dataset: DataHub Commodity Prices v2
Part of experiment: Bitcoin - Bitcoin Historical Price USD – All-Time Series (Habrador) vs DataHub Commodity Prices v2