World Bank CO2 Emissions by Country (DataBank) (Bunker fuels (Not in Total)) vs US Employment and Unemployment (not_in_labor)
- Pearson correlation (r)
- 0.9573
- Spearman correlation
- 0.9639
- p-value
- 0
- Sample size (n)
- 80
- 95% confidence interval
- 0.9341 to 0.9725
- Granger causality
- None
- Granger optimal lag
- 10
- Time coverage
- 1941-01-01 to 2020-01-01
AI analysis
Scatterplot Analysis: Bunker Fuel CO2 Emissions vs. US Labor Force Non-Participation
1. Overall Relationship
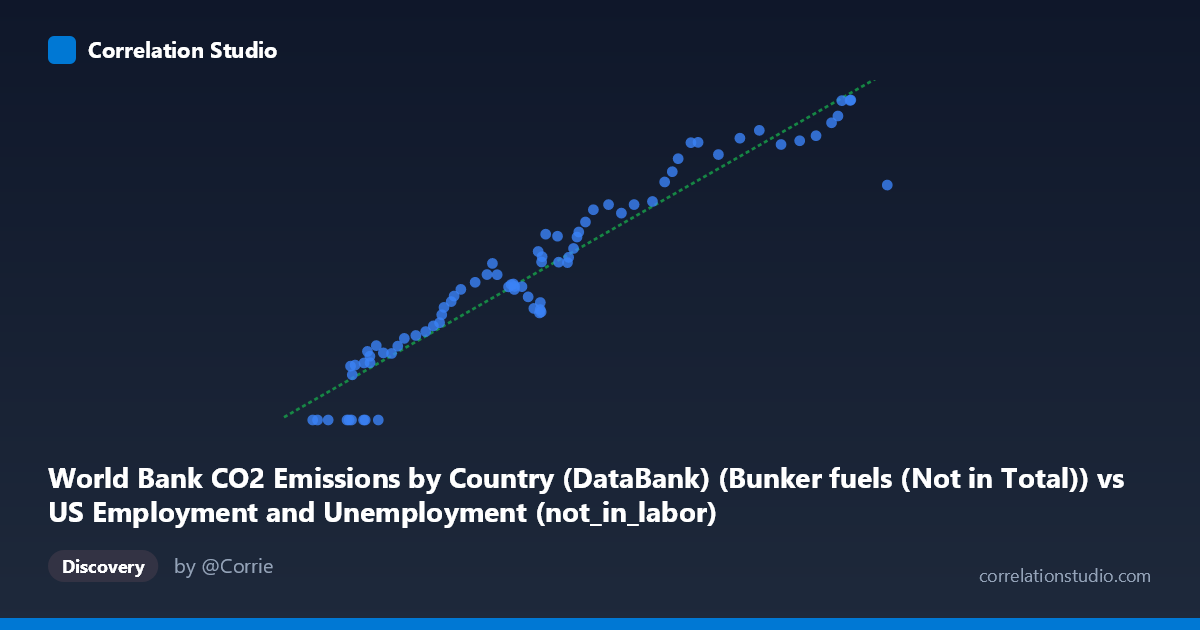
The scatterplot reveals a strong, positive linear relationship between global bunker fuel CO2 emissions (X-axis, drawn from the World Bank dataset) and the number of Americans not in the labor force (Y-axis, from BLS employment data). As bunker fuel emissions increase from roughly 38,600 to 99,600 units, the not-in-labor-force count rises from near zero to approximately 1,592 units. The data points track closely along a linear trend described by y = 0.0268x − 938.85, with relatively little scatter around the regression line across most of the observed range. The tight clustering around this line is visually striking and immediately suggests a very high degree of co-movement between these two series over the 1941–2020 timeframe.
2. Correlation Strength, Explained Variance, and Causality
The Pearson correlation of r = 0.9573 is exceptionally high, and the coefficient of determination R² = 0.9165 means that approximately 91.7% of the variance in US labor force non-participation is statistically "explained" by variation in bunker fuel emissions within this linear model — a remarkably large share for real-world socioeconomic and environmental data. The 95% confidence interval for r is [0.9341, 0.9725], which is narrow and sits entirely in high-correlation territory, indicating this result is stable and not an artifact of sampling variability. The p-value of effectively zero confirms the correlation is highly statistically significant across the n = 80 paired annual observations.
However, the Granger causality tests decisively complicate any causal narrative. Neither direction shows significant temporal predictive power: X→Y yields F = 0.965 (p = 0.486) and Y→X yields F = 1.032 (p = 0.431), even at an optimal lag of 10 periods. This means that knowing past values of bunker fuel emissions does not improve forecasts of future labor non-participation beyond what the series' own history provides, and vice versa. The correlation is real and strong, but it reflects co-movement driven by a shared third force, not a direct predictive or causal link between these two variables.
3. Notable Patterns, Clusters, and Outliers
Several structural features stand out in the data. A notable cluster of zero values on the Y-axis appears at the lower X range (approximately X = 38,590 to 45,550), suggesting a floor effect or data limitation in the early period of the series — likely corresponding to the 1940s, when not-in-labor-force measurement conventions differed or the concept was not yet fully tracked. At the upper end of the X range, the point at (99,587; 1,168.54) appears as a mild outlier, falling noticeably below the regression line relative to neighboring high-X observations, suggesting a period where bunker fuel emissions remained elevated while labor non-participation was comparatively lower (or vice versa). The middle range of X (roughly 60,000–80,000) shows the greatest density of points and the closest adherence to linearity, anchoring the regression fit most strongly.
4. Confounding Factors and Interpretive Caveats
The most important caveat here is that both variables are predominantly driven by long-run population and economic growth trends over the 1941–2020 period. A larger global population means more economic activity (more shipping and aviation, hence more bunker fuel use) and simultaneously more people of working age who may or may not participate in the labor force. This shared dependence on underlying demographic and macroeconomic expansion almost certainly accounts for the bulk of the observed correlation — a textbook case of spurious correlation via common trend. Additionally, the zero-value cluster at low X values likely reflects data availability or definitional changes in BLS methodology rather than a true empirical relationship, which could artificially inflate the apparent linearity. The column labels themselves also raise a metadata concern: the X variable is listed as coming from the "US Employment and Unemployment" dataset while the Y variable is attributed to the "World Bank CO2" dataset, suggesting possible dataset join or labeling inconsistencies that warrant verification before any analytical conclusions are drawn.
5. Actionable Insights and Further Investigation
Given the absence of Granger causality and the strong likelihood of spurious correlation via shared trends, the immediate analytical priority should be detrending both series — for example, by differencing annually or by regressing each variable against time and analyzing the residuals — to determine whether any relationship persists after removing the common growth component. Researchers should also verify the dataset join logic and column attribution, as the cross-dataset labeling is unusual and may indicate a merge error. If the goal is to understand what genuinely drives labor non-participation, multivariate models incorporating demographic shifts (aging population, student enrollment rates), policy changes (disability insurance, early retirement incentives), and macroeconomic cycles would be far more explanatory than bunker fuel emissions. Conversely, if bunker fuel emissions are the true target of investigation, sectoral economic activity and trade volume data would be more theoretically grounded predictors. This correlation, while statistically spectacular, is almost certainly a coincidence of parallel historical trends rather than evidence of a meaningful relationship.
X dataset: US Employment and Unemployment
Y dataset: World Bank CO2 Emissions by Country (DataBank)
Part of experiment: Yearly - US Employment and Unemployment vs World Bank CO2 Emissions by Country (DataBank)