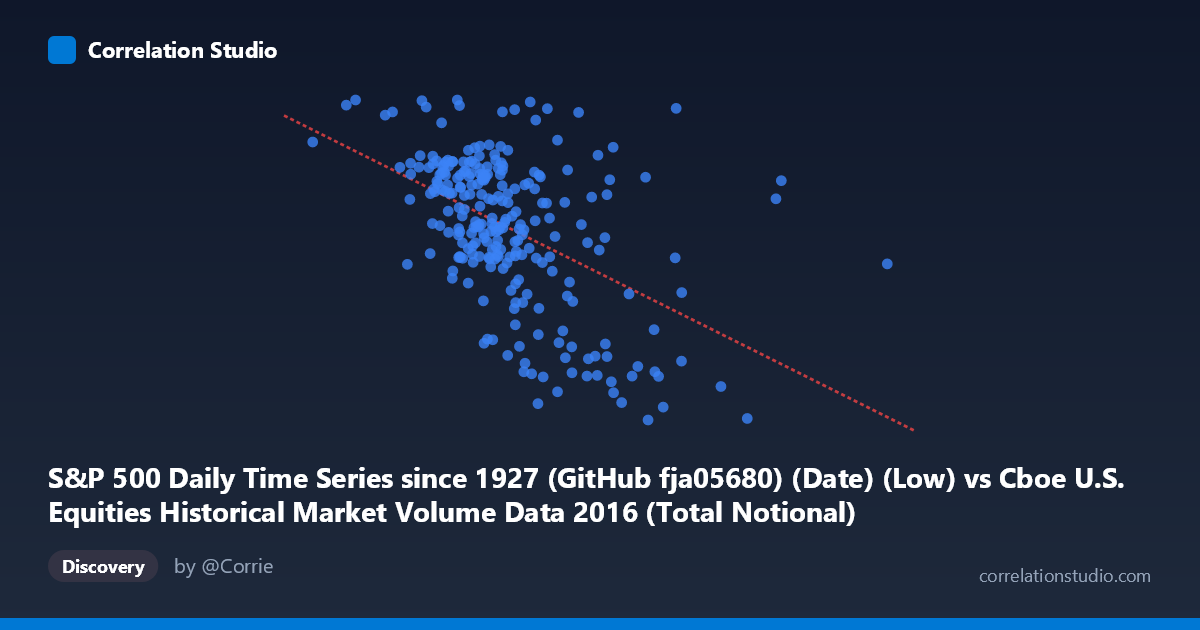
S&P 500 Daily Time Series since 1927 (GitHub fja05680) (Date) (Low) vs Cboe U.S. Equities Historical Market Volume Data 2016 (Total Notional)
- Pearson correlation (r)
- -0.4955
- Spearman correlation
- -0.4897
- p-value
- 0
- Sample size (n)
- 252
- 95% confidence interval
- -0.5833 to -0.3962
- Granger causality
- None
- Granger optimal lag
- 4
AI analysis
Scatterplot Analysis: S&P 500 Low Price vs. Cboe Total Notional Volume (2016)
Relationship Overview The scatterplot reveals a moderate negative relationship between the S&P 500 daily low price and Cboe U.S. Equities total notional trading volume across 2016. As the S&P 500 low price increases, total notional volume tends to decrease, suggesting that higher price levels in the index correspond with quieter, lower-volume trading days. This inverse pattern is visually apparent as a downward-sloping cloud of points, though with considerable scatter throughout, indicating the relationship is real but far from deterministic.
Correlation Strength and Statistical Significance The Pearson correlation of r = -0.4955 reflects a moderate negative association, but the explanatory power is notably limited — r² = 0.2455 means only ~24.6% of the variance in total notional volume is explained by the S&P 500 low price. The remaining ~75% is driven by other factors entirely. The 95% confidence interval of [-0.5833, -0.3962] is reasonably tight and does not cross zero, lending confidence that the negative direction is reliable. The p-value of effectively 0 confirms the correlation is highly statistically significant at n = 252, ruling out chance as an explanation. However, statistical significance here should be interpreted carefully — with a large population of N = 3,622 underlying observations, even modest correlations can achieve significance. Critically, Granger causality testing found no significant predictive directionality in either direction (X→Y: F = 0.5354, p = 0.7098; Y→X: F = 1.0275, p = 0.3937), meaning that past S&P 500 low prices do not meaningfully predict future notional volume, and vice versa. This strongly cautions against any causal interpretation of the correlation.
Notable Patterns, Clusters, and Outliers The data cloud is broadly concentrated in the X range of roughly 14–22 billion, with Y values clustering between 2,000 and 2,200, forming a dense central core. Several notable outliers are visible at the extremes: points with very high notional volume (approaching 2,265–2,266) cluster at relatively low S&P 500 price levels (~13.9–15.7B), consistent with the negative trend. Conversely, a cluster of points with unusually high X values (~24–26B) displays notably depressed Y values (~1,848–1,874), which likely corresponds to specific high-volatility, high-volume episodes in early 2016 when the market was under stress. The point at approximately (13.96B, 2,265) stands out as a potential high-leverage outlier that may be disproportionately influencing the regression slope. The linear fit (y = -1.227×10⁻⁸x + 2317.07) captures the general trend, but residual scatter suggests non-linear dynamics or regime-dependent behavior worth investigating.
Confounding Factors and Caveats Several important confounders likely mediate this relationship rather than the price level itself causing volume changes. Market volatility is a primary candidate — periods of lower prices in 2016 (particularly Q1) coincided with heightened uncertainty (oil price shocks, China slowdown fears), which simultaneously depressed prices and elevated trading volume. Seasonal and calendar effects (e.g., year-end rebalancing, options expiration dates) can independently influence both variables. The axis labels also warrant attention: the X-axis references the S&P 500 low (the intraday low price), which is a more volatile measure than the close, potentially amplifying the apparent relationship during stressed days. Additionally, notional volume is price-dependent by construction (shares × price), which creates a subtle mechanical circularity — as index prices rise, the same share volume produces higher notional values, partially counteracting the observed negative correlation and suggesting the true relationship may be even more nuanced.
Actionable Insights and Further Investigation Practitioners should avoid using S&P 500 price levels alone as a predictor of notional volume given the failed Granger causality and modest r². A more productive approach would incorporate VIX (volatility index) as a mediating variable, which likely explains much of the residual 75% variance. It would be valuable to segment the data by market regime (e.g., high-volatility Q1 2016 vs. the calmer mid-year period) to test whether the correlation is regime-dependent rather than a stable structural relationship. Investigating whether the relationship strengthens when using realized volatility or the daily price range (High − Low) instead of the raw low price could yield better predictive models. Finally, extending this analysis beyond 2016 using the full historical S&P 500 dataset would help determine whether this inverse relationship is a persistent feature of equity market microstructure or an artifact of 2016's specific market conditions.
X dataset: Cboe U.S. Equities Historical Market Volume Data 2016
Y dataset: S&P 500 Daily Time Series since 1927 (GitHub fja05680) (Date)
Part of experiment: Daily - Cboe U.S. Equities Historical Market Volume Data 2016 vs S&P 500 Daily Time Series since 1927 (GitHub fja05680) (Date)