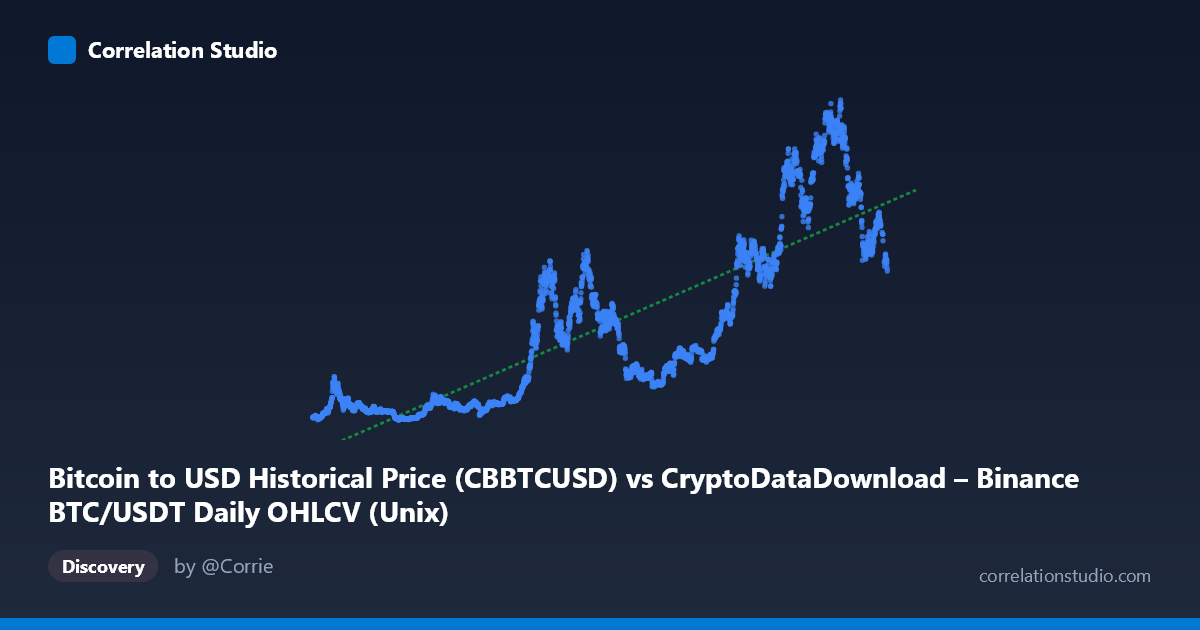
Bitcoin to USD Historical Price (CBBTCUSD) vs CryptoDataDownload – Binance BTC/USDT Daily OHLCV (Unix)
- Pearson correlation (r)
- 0.8415
- Spearman correlation
- 0.8874
- p-value
- 0
- Sample size (n)
- 3211
- 95% confidence interval
- 0.8311 to 0.8513
- Granger causality
- None
- Granger optimal lag
- 10
- Time coverage
- 2017-08-17 to 2026-06-25
- Recomputed on refreshed data
- 2026-10-24 (r was 0.8415)
AI analysis
Analysis: BTC/USDT (Binance) vs. Bitcoin USD (Coinbase) Price Series
1. What the Visualization Reveals
This scatterplot is essentially comparing the same underlying asset—Bitcoin—priced on two different exchanges (Binance vs. Coinbase) over roughly 8.8 years (2017–2026). Because both series track the market price of BTC, the plot should show a strong positive relationship, and it does. The X-axis (Unix timestamp) acts as a time index rather than a true independent variable, so this chart is functionally closer to two overlaid time series than a classic bivariate relationship — the "correlation" here is largely a byproduct of both prices trending upward together over the same historical period (BTC's multi-year bull/bear cycles).
2. Strength, Direction, and Statistical Confidence
The correlation is strong and positive (r = 0.84, R² = 0.71), meaning about 71% of the variance in one exchange's price is statistically associated with the timestamp/other series' movement. The 95% CI [0.831, 0.851] is tight, and p ≈ 0 confirms this relationship is not due to chance — with n=3,211 daily observations, even modest correlations would be significant, but here the effect size is also large. However, the Granger causality results are important: neither direction shows significant predictive causality (X→Y p=0.076, Y→X p=0.391) at the optimal 10-lag specification. This tells us that despite the strong contemporaneous correlation, neither series meaningfully helps forecast the other's future values beyond its own history — consistent with two near-identical, simultaneously-arbitraged price feeds rather than a lead-lag trading relationship.
3. Notable Patterns and Non-Linear Features
The sample points reveal Bitcoin's characteristic non-linear, regime-based price action: multi-year accumulation near $3,000–$12,000 (2018–2020), a violent 2021 run to ~$60,000, a 2022 drawdown back to the $16,000–$20,000 range, and an explosive 2024–2025 rally exceeding $110,000–$124,000. This produces a scatterplot that likely shows clustering at low values (long consolidation periods) with a widening, accelerating spread at high values — a classic exponential/power-law growth pattern rather than a linear one. The linear R² of 0.71, while strong, likely understates fit quality during flat periods and overstates it during the explosive tail, suggesting a log-transformed regression would fit far better than the reported linear model (y = 3.4e-7·x − 521,802).
4. Confounding Factors and Caveats
The central caveat: X (timestamp) is not a meaningful causal driver of Y (price) — time doesn't cause price appreciation; it's simply the axis along which both correlated price series evolve. The "relationship" is confounded by shared market fundamentals (halving cycles, macro liquidity, regulatory news, ETF approvals) that drive Bitcoin's price on both exchanges simultaneously. Additionally, treating cross-exchange price data as two variables is somewhat artificial — Binance and Coinbase BTC/USD prices are cointegrated via arbitrage and should differ only by small spreads/lags, not by independent variance worth decomposing via R².
5. Actionable Insights
Given the non-Granger-causal result, this analysis is better suited to studying arbitrage spread and lag structure between exchanges (e.g., microsecond/hourly price divergence, liquidity-driven premiums) rather than treating it as a predictive modeling exercise. For genuine forecasting value, analysts should: (a) refit using log-price or percentage returns rather than raw price and timestamp, (b) test cointegration (e.g., Engle-Granger or Johansen) rather than simple Granger causality on levels, and (c) investigate the residual spread between exchanges as a signal for arbitrage opportunities or exchange-specific liquidity/risk premiums, especially around the extreme rallies (2021, 2024–2025) where dispersion may spike.
X dataset: CryptoDataDownload – Binance BTC/USDT Daily OHLCV
Y dataset: Bitcoin to USD Historical Price
Part of experiment: Bitcoin - CryptoDataDownload – Binance BTC/USDT Daily OHLCV vs Bitcoin to USD Historical Price