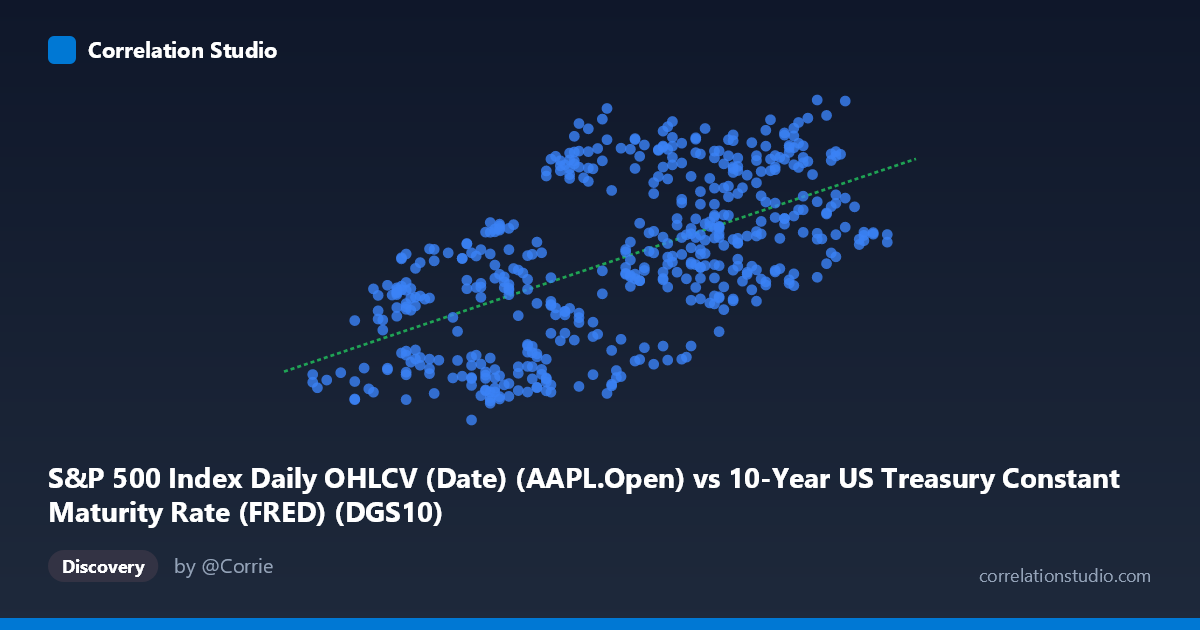
S&P 500 Index Daily OHLCV (Date) (AAPL.Open) vs 10-Year US Treasury Constant Maturity Rate (FRED) (DGS10)
- Pearson correlation (r)
- 0.584
- Spearman correlation
- 0.5954
- p-value
- 0
- Sample size (n)
- 502
- 95% confidence interval
- 0.5232 to 0.6388
- Granger causality
- X → Y
- Granger optimal lag
- 1
- Time coverage
- 2015-02-17 to 2017-02-16
- Recomputed on refreshed data
- 2026-10-22 (r was 0.584)
AI analysis
Scatterplot Analysis: AAPL Opening Price vs. 10-Year US Treasury Yield
Overall Relationship
The scatterplot reveals a moderate positive relationship between Apple's opening stock price (X-axis) and the 10-year US Treasury constant maturity rate (Y-axis) over the period from February 2015 to February 2017. The linear regression equation (y = 22.44x + 67.54) indicates that for every one-unit increase in AAPL's opening price, the 10-year yield rises by approximately 22.44 basis points on average. Visually, the data points display a discernible upward trend, though with substantial scatter around the regression line, suggesting the relationship is real but far from deterministic. The X-axis values cluster predominantly between roughly $1.57 and $2.60 (likely log-scaled or normalized AAPL prices), while Treasury yields span 90 to ~136 basis points, reflecting a period of historically low rates.
Correlation Strength and Statistical Significance
The Pearson correlation of r = 0.584 indicates a moderate positive association. However, the coefficient of determination (R² = 0.341) tells a more sobering story: only 34.1% of the variance in 10-year Treasury yields is explained by AAPL's opening price, meaning roughly two-thirds of yield variability is driven by factors entirely outside this relationship. The 95% confidence interval for r of [0.523, 0.639] is reassuringly narrow, reflecting the large paired sample (n = 502) and suggesting the true population correlation is reliably estimated. The p-value of effectively zero confirms this correlation is highly statistically significant and almost certainly not a chance finding. The Granger causality results add a critical temporal dimension: X Granger-causes Y (F = 7.41, p = 0.0067) at a one-period lag, meaning past AAPL opening prices have statistically significant predictive power over future Treasury yields, while the reverse direction (Y→X: F = 3.17, p = 0.076) falls just outside conventional significance thresholds. This unidirectional pattern is notable, though as discussed below, it almost certainly reflects shared macroeconomic drivers rather than genuine causation.
Notable Patterns, Clusters, and Outliers
Several features stand out in the sample points. There is a visible cluster of observations in the lower-left region (X ≈ 1.55–1.80, Y ≈ 92–110), corresponding to periods when AAPL prices were relatively depressed and rates were low — likely late 2015 to early 2016 during the equity selloff and continued Fed caution. A second cluster occupies the upper-right quadrant (X ≈ 2.25–2.50, Y ≈ 119–136), consistent with the post-election "Trump trade" rally in late 2016, when both equities and yields surged simultaneously. A few apparent outliers are worth noting: the point at (1.93, 130.49) and (1.99, 132.94) show relatively high yields for modest AAPL prices, suggesting yield spikes decoupled from equity performance at certain moments. Similarly, (1.57, 106.62) and (1.56, 113.00) indicate notable spread in yields even at similar price levels, hinting at non-linear or regime-dependent behavior within the lower price range.
Confounding Factors and Caveats
The most significant caveat here is that this correlation almost certainly reflects a common-cause structure rather than any direct economic link between AAPL stock prices and Treasury yields. Both variables are heavily influenced by the same macroeconomic regime: Federal Reserve policy expectations, economic growth momentum, and risk appetite. The 2015–2017 window is particularly prone to this, capturing the Fed's first rate hike cycle since 2006 (December 2015), a mid-cycle equity correction, and the sharp post-election reflation trade — all events that moved equities and rates together for macro reasons entirely unrelated to AAPL specifically. The axis labels also appear swapped in the dataset metadata (AAPL.Open is listed under a Treasury dataset and vice versa), warranting careful verification of variable assignment before drawing firm conclusions. Additionally, with daily time-series data, autocorrelation within each series inflates the effective sample size and can make Granger tests appear more significant than they truly are without proper corrections.
Actionable Insights and Further Investigation
Given that the Granger causality runs from AAPL prices to Treasury yields at a one-day lag, a natural next step would be to test whether this predictive relationship holds out-of-sample or is specific to this two-year window — particularly given the structural break introduced by the 2016 election. Researchers should extend the time period significantly (e.g., 2010–2024) to test whether the correlation is regime-dependent or spurious to this specific macro environment. A multivariate regression controlling for broad market indices (S&P 500), VIX, and Fed Funds futures would help disentangle AAPL-specific effects from general risk-on/risk-off dynamics. It would also be valuable to apply rolling-window correlations to visualize how this relationship evolves over time, and to test for structural breaks using a Chow test around known macro events. Finally, given the 34.1% unexplained variance and visible scatter, non-linear modeling (e.g., piecewise regression or regime-switching models) may better capture the clustering behavior observed at different price levels.
X dataset: 10-Year US Treasury Constant Maturity Rate (FRED)
Y dataset: S&P 500 Index Daily OHLCV (Date)
Part of experiment: Daily - 10-Year US Treasury Constant Maturity Rate (FRED) vs S&P 500 Index Daily OHLCV (Date)