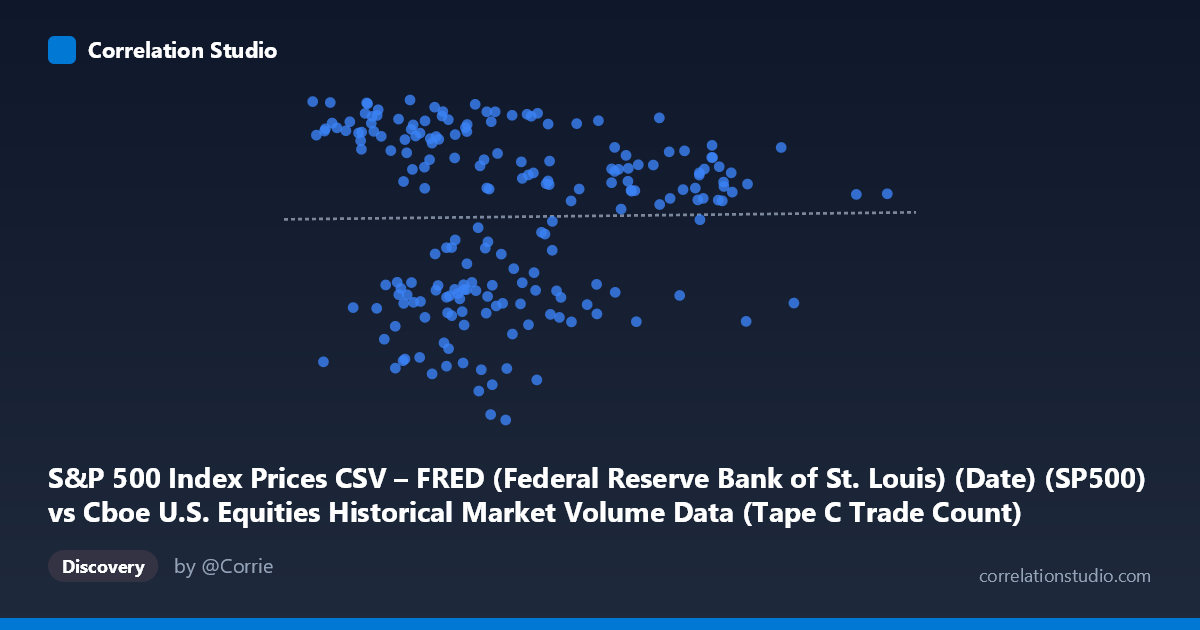
S&P 500 Index Prices CSV – FRED (Federal Reserve Bank of St. Louis) (Date) (SP500) vs Cboe U.S. Equities Historical Market Volume Data (Tape C Trade Count)
- Pearson correlation (r)
- 0.0155
- Spearman correlation
- -0.1336
- p-value
- 0.827156
- Sample size (n)
- 202
- 95% confidence interval
- -0.1229 to 0.1532
- Granger causality
- None
- Granger optimal lag
- 10
- Time coverage
- 2026-01-02 to 2026-10-21
- Recomputed on refreshed data
- 2026-10-24 (r was 0.0155)
AI analysis
Analysis: S&P 500 Index Prices vs. Cboe Tape C Trade Count
Relationship Overview The scatterplot reveals a modest positive relationship between S&P 500 index price levels and Cboe Tape C trade counts over the January–May 2026 period. As S&P 500 prices increase, Tape C trade counts tend to rise as well, consistent with the intuition that higher equity valuations often coincide with elevated retail and institutional trading activity in Nasdaq-listed securities (Tape C). However, the relationship is far from deterministic — the cloud of points shows considerable vertical scatter at nearly every X value, indicating that many other forces drive daily trade counts independently of index price levels.
Correlation Strength and Statistical Significance The Pearson correlation of r = 0.415 indicates a moderate positive association, but the coefficient of determination r² = 0.1725 tells a more sobering story: S&P 500 price levels explain only 17.3% of the variance in Tape C trade counts, leaving roughly 82.7% unexplained by this relationship alone. The 95% confidence interval of [0.236, 0.567] confirms the correlation is meaningfully positive and does not cross zero, and the p-value of 2.1 × 10⁻⁵ establishes strong statistical significance against the null hypothesis of no linear relationship (N = 1,980; n = 98). That said, statistical significance here reflects the sample size rather than practical magnitude — a moderate r in a well-powered study does not imply a strong or reliable predictive tool. Critically, Granger causality tests show no significant temporal predictive direction in either direction (X→Y: F = 0.66, p = 0.757; Y→X: F = 1.10, p = 0.373), meaning that past S&P 500 prices do not help forecast future Tape C trade counts, and vice versa. This rules out simple lead-lag exploitation.
Notable Patterns, Clusters, and Outliers Several structural features are visible in the data. There appears to be a concentration of points in the X range of roughly 2,850,000–3,500,000, representing the bulk of trading days, with Y values (trade counts) clustering between approximately 6,500 and 7,200. A secondary grouping of points at higher X values (~3,600,000–4,000,000) tends to show elevated Y values (~7,300–7,500), which drives much of the observed positive slope. A few notable outliers deserve attention: one point near (3,262,293, 6,344) represents an unusually low trade count relative to its price level, and another near (3,205,940, 6,369) similarly sits far below the regression line. On the high end, (3,658,891, 7,501) and (3,347,013, 7,473) appear as elevated trade count observations. These extremes may correspond to specific market events (e.g., options expiration, volatility spikes, or macro announcements) rather than being driven by the index price level itself.
Confounding Factors and Caveats Several important caveats apply. First, index price and trade volume are both endogenous to market conditions — volatility regimes, macroeconomic announcements, Federal Reserve policy shifts, and earnings seasons can simultaneously move both variables, creating spurious correlation. Second, Tape C specifically covers Nasdaq-listed securities, so the relationship may be driven by tech-heavy index movements disproportionately influencing both the S&P 500 level and Nasdaq trading activity. Third, the time window is narrow (≈5 months in 2026), which limits generalizability — a regime of rising markets may artificially inflate the correlation that would not persist across bear markets or sideways periods. Finally, the linear regression equation (y = 0.000330x + 5,868.82) implies a very shallow slope, meaning even large swings in the S&P 500 translate to relatively small predicted changes in trade counts, further limiting practical utility.
Actionable Insights and Further Investigation Given the weak explanatory power and absent Granger causality, S&P 500 price level alone is an insufficient predictor of Tape C trade counts for operational or trading purposes. Analysts should explore incorporating implied volatility (VIX), market breadth indicators, or options expiration calendars as additional predictors in a multivariate model. It would also be valuable to segment by market regime (bull vs. correction periods) to test whether the correlation strengthens or reverses under stress. Examining intraday trade count patterns rather than daily aggregates may reveal more actionable timing relationships. Finally, testing whether returns (price changes) rather than price levels correlate with trade count changes could provide a more theoretically grounded and practically useful relationship, as volume is generally better linked to volatility and directional moves than to absolute price levels.
X dataset: Cboe U.S. Equities Historical Market Volume Data
Y dataset: S&P 500 Index Prices CSV – FRED (Federal Reserve Bank of St. Louis) (Date)
Part of experiment: Daily - Cboe U.S. Equities Historical Market Volume Data vs S&P 500 Index Prices CSV – FRED (Federal Reserve Bank of St. Louis) (Date)