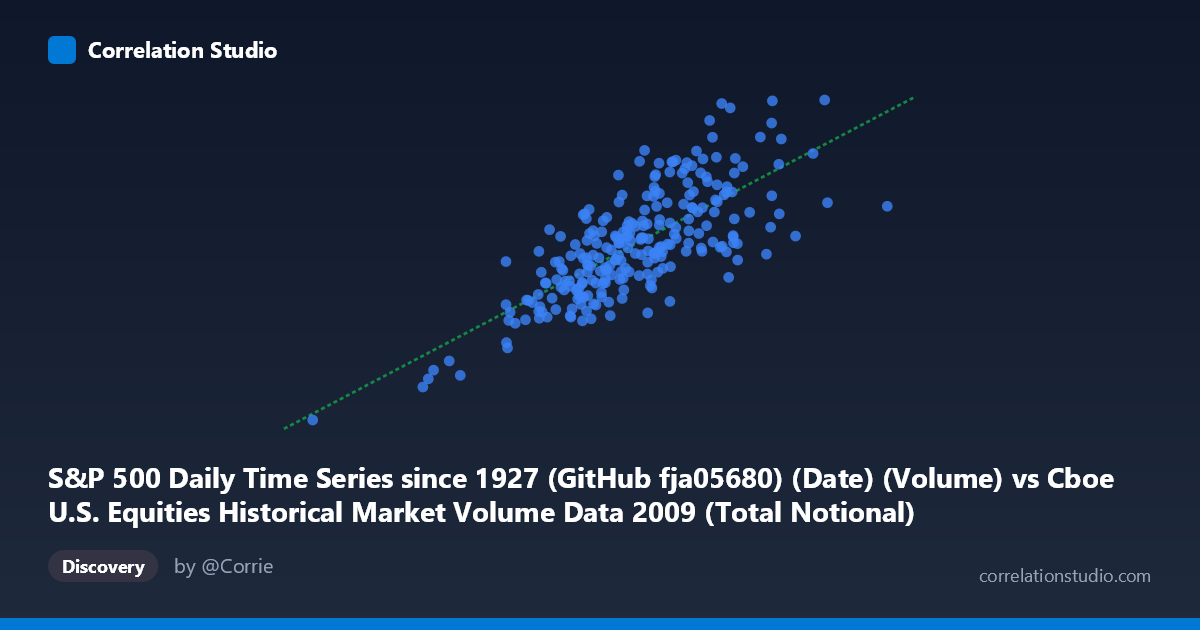
S&P 500 Daily Time Series since 1927 (GitHub fja05680) (Date) (Volume) vs Cboe U.S. Equities Historical Market Volume Data 2009 (Total Notional)
- Pearson correlation (r)
- 0.7509
- Spearman correlation
- 0.7343
- p-value
- 0
- Sample size (n)
- 252
- 95% confidence interval
- 0.6915 to 0.8003
- Granger causality
- X → Y
- Granger optimal lag
- 10
AI analysis
Analysis: S&P 500 Trading Volume vs. Cboe Total Notional Value (2009)
Relationship Overview The scatterplot reveals a moderately strong positive relationship between S&P 500 daily trading volume and the total notional value of U.S. equities traded on Cboe exchanges throughout 2009. As trading volume increases, total notional value tends to rise in a broadly linear fashion, consistent with the fitted regression equation y = 0.3418x − 301,506,000. This is economically intuitive: higher share volume, all else equal, should translate into greater dollar-denominated notional turnover. The relationship is not perfectly tight, however — there is meaningful vertical scatter at nearly every level of X, suggesting that price levels, volatility regimes, and the composition of traded securities introduce substantial independent variation in notional value even when raw volume is held constant.
Correlation Strength and Statistical Significance The Pearson correlation of r = 0.7509 indicates a moderately strong positive association, but the r² of 0.5639 is the more sobering figure: only about 56.4% of the variance in total notional value is explained by trading volume, leaving roughly 44% attributable to other factors. The 95% confidence interval for r of [0.6915, 0.8003] is reasonably narrow given n = 252 paired daily observations drawn from a population of N = 3,232, and the p-value of effectively zero confirms the relationship is not a sampling artifact. Critically, Granger causality testing establishes a unidirectional predictive relationship: X (S&P 500 volume) Granger-causes Y (total notional value) at an optimal lag of 10 trading periods (F = 2.48, p = 0.008), while the reverse direction fails to reach significance (F = 1.43, p = 0.170). This means past volume readings carry statistically meaningful forward-looking information about notional turnover roughly two calendar weeks later, but notional value does not similarly predict future volume — a finding with practical relevance for market surveillance and liquidity forecasting.
Notable Patterns, Clusters, and Outliers Several features stand out visually. The bulk of observations cluster in a dense core roughly spanning X values of 14–22 billion shares and Y values of 4–7.5 billion dollars in notional value, reflecting the relatively stable mid-year trading environment. There is a distinct lower-left outlier cluster — most notably the point near (5.04B, 1.27B) and a secondary grouping around (9.4B, 2.28B) — almost certainly corresponding to the low-volume, low-notional holiday-adjacent sessions or the market nadir of early March 2009. Conversely, the upper-right region contains high-leverage outlier points such as (24.4B, 9.12B) and (20.8B, 8.93B), likely coinciding with peak volatility episodes during the post-crisis recovery rally. These extremes disproportionately drive the regression fit and may inflate the apparent correlation strength. Additionally, some high-X observations pair with surprisingly moderate Y values (e.g., ~20.75B volume yielding only ~4.77B notional), hinting at periods where high-frequency, low-price stock trading dominated volume without proportionally lifting notional turnover.
Confounding Factors and Caveats Several important caveats temper interpretation. First, price level is the missing variable: notional value equals volume × average price, so the S&P 500's dramatic price recovery from ~666 in March to ~1,115 by December 2009 means the X–Y relationship is partially mediated by price appreciation rather than reflecting a pure volume-to-notional mechanism. Second, the two datasets originate from different sources (GitHub/Yahoo Finance for S&P 500 volume; Cboe for notional), covering overlapping but not identical market perimeters — Cboe notional includes multiple exchanges and TRFs, while S&P 500 volume is index-constituent specific. Third, Granger causality establishes temporal precedence, not economic causation; the 10-lag relationship may partly reflect autocorrelation structures common to both series during a volatile recovery year rather than a genuine causal mechanism. Finally, 2009 was an extreme and structurally unusual year, limiting generalizability of these estimates to normal market conditions.
Actionable Insights and Further Investigation Practitioners in market microstructure, exchange operations, or risk management could leverage the Granger causality result to build 10-day-ahead notional volume forecasts using current S&P 500 volume as a leading indicator, potentially useful for capacity planning or margin exposure modeling. To deepen this analysis, a multivariate regression incorporating average daily price level (or VIX as a volatility proxy) should be estimated to partial out the price-mediation effect and isolate the pure volume signal — the r² would likely rise substantially. It would also be valuable to segment the data chronologically (Q1 crisis trough vs. Q2–Q4 recovery) to test whether the correlation structure is stable or regime-dependent, as the outlier cluster evidence suggests it may not be. Finally, extending this analysis across multiple years would clarify whether the 10-period Granger lag is a robust structural feature or an artifact of 2009's unique volatility environment.
X dataset: Cboe U.S. Equities Historical Market Volume Data 2009
Y dataset: S&P 500 Daily Time Series since 1927 (GitHub fja05680) (Date)
Part of experiment: Daily - Cboe U.S. Equities Historical Market Volume Data 2009 vs S&P 500 Daily Time Series since 1927 (GitHub fja05680) (Date)