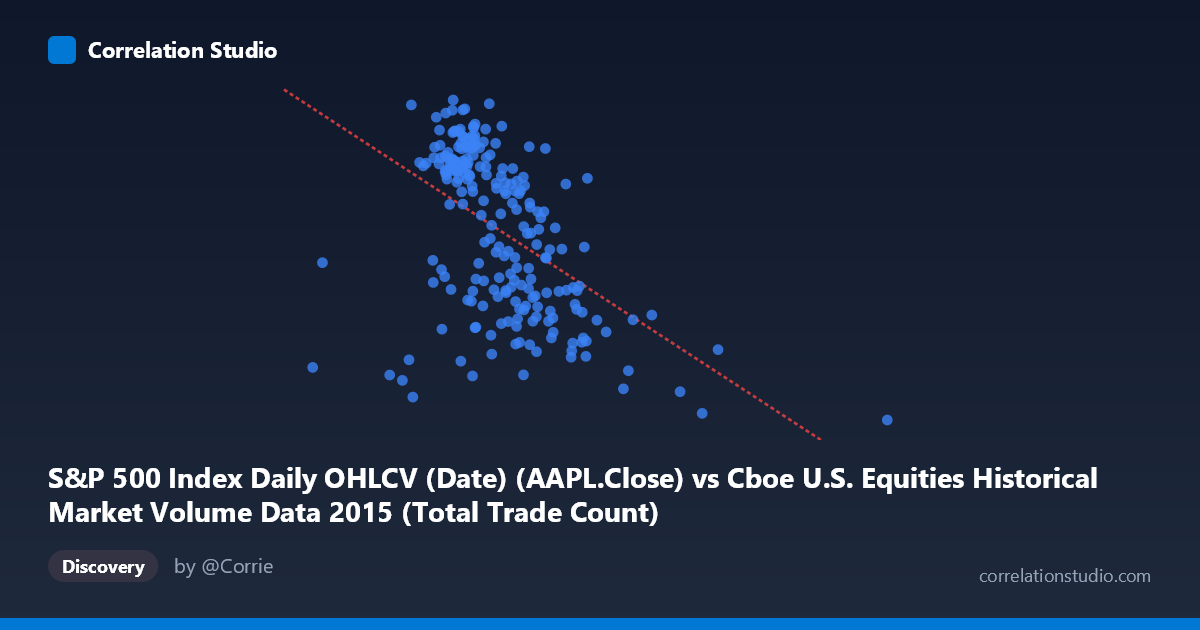
S&P 500 Index Daily OHLCV (Date) (AAPL.Close) vs Cboe U.S. Equities Historical Market Volume Data 2015 (Total Trade Count)
- Pearson correlation (r)
- -0.495
- Spearman correlation
- -0.5354
- p-value
- 0
- Sample size (n)
- 222
- 95% confidence interval
- -0.5883 to -0.3886
- Granger causality
- None
- Granger optimal lag
- 1
AI analysis
Analysis: AAPL Close Price vs. Cboe Total Trade Count (2015)
Relationship Overview The scatterplot reveals a negative relationship between Apple's daily closing price (X-axis) and the total trade count on U.S. equities exchanges (Y-axis) throughout 2015. As AAPL's closing price increases, the total number of trades tends to decrease, and vice versa. This inverse pattern suggests that periods of higher AAPL valuations were generally associated with calmer, lower-volume trading environments across the broader market, while declining AAPL prices coincided with elevated market-wide trading activity — consistent with the well-documented tendency for trade counts to surge during periods of market stress and volatility.
Correlation Strength and Statistical Significance The Pearson correlation of r = −0.495 indicates a moderate negative association. The r² value of 0.245 means that only 24.5% of the variance in total trade count is explained by AAPL's closing price, leaving roughly three-quarters of the variation attributable to other factors entirely. The 95% confidence interval of [−0.589, −0.389] is meaningfully negative throughout and does not cross zero, and the p-value of 3.997 × 10⁻¹⁵ confirms this relationship is highly statistically significant — virtually impossible to attribute to random chance. However, the Granger causality results are unambiguous: neither direction (X→Y: F = 0.63, p = 0.43; Y→X: F = 0.005, p = 0.95) reaches significance at any conventional threshold. This means that while a contemporaneous correlation exists, neither variable temporally predicts the other at a one-period lag, strongly cautioning against any causal or predictive interpretation.
Notable Patterns, Clusters, and Outliers The bulk of observations cluster between AAPL closing prices of roughly $105–$135 and trade counts between ~108–133 million, forming a moderate downward-sloping cloud. However, at least two prominent outliers stand out: one point near (5,549,284, 103.12) — far to the right of the main cluster — and another near (4,083,023, 103.74), both representing days of exceptionally high trade counts with low AAPL prices. These outliers likely correspond to identifiable market events (e.g., August 2015 flash crash) and exert disproportionate leverage on the regression line. Additionally, a lower-left outlier near (1,074,584, 117.81) deviates from the main cluster in the opposite direction. The scatter is noticeably heteroscedastic, with variance in trade counts widening at lower AAPL price levels.
Confounding Factors and Caveats Several important caveats apply. First, the axis labels appear swapped in the dataset metadata — AAPL Close is listed as a column from the Cboe dataset and vice versa, suggesting a possible data join artifact that warrants verification. Second, AAPL's price decline across 2015 and market volatility spikes (particularly August–September 2015) are both driven by common macroeconomic factors — China slowdown fears, Federal Reserve rate uncertainty — making this a likely case of spurious correlation through shared confounders rather than any direct mechanism. Third, the linear regression slope of −7.69 × 10⁻⁶ is numerically tiny, reflecting the extreme scale difference between the two variables. Non-linear models or log-transformations may better characterize the relationship, especially given the influential outliers.
Actionable Insights and Further Investigation Analysts should verify the dataset join logic and axis assignments before drawing further conclusions, as the metadata inconsistency undermines interpretive confidence. It would be valuable to remove or separately analyze the extreme outliers (particularly the August 2015 volatility event) to assess how much the correlation is event-driven versus structural. Expanding the analysis to include VIX (volatility index) as a covariate would likely absorb much of the shared variance and test whether the AAPL–trade count relationship persists after controlling for market stress. Finally, exploring non-linear specifications (polynomial or piecewise regression) and extending the analysis to other large-cap stocks would clarify whether this pattern is AAPL-specific or reflects a broader market dynamic.
X dataset: Cboe U.S. Equities Historical Market Volume Data 2015
Y dataset: S&P 500 Index Daily OHLCV (Date)
Part of experiment: Daily - Cboe U.S. Equities Historical Market Volume Data 2015 vs S&P 500 Index Daily OHLCV (Date)