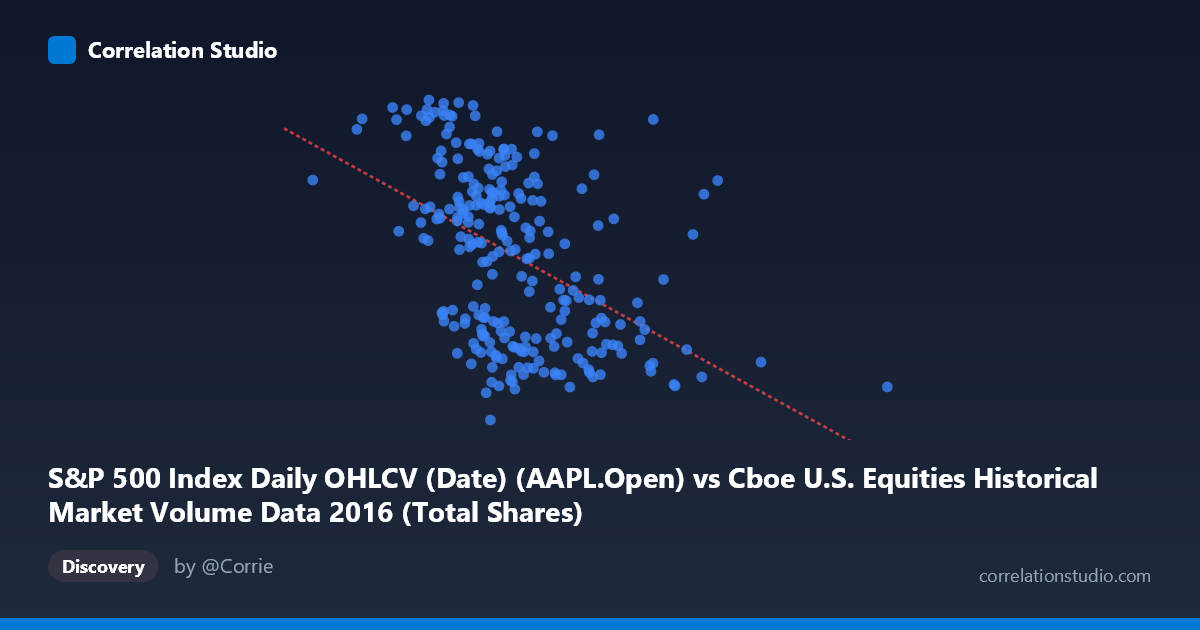
S&P 500 Index Daily OHLCV (Date) (AAPL.Open) vs Cboe U.S. Equities Historical Market Volume Data 2016 (Total Shares)
- Pearson correlation (r)
- -0.4606
- Spearman correlation
- -0.4884
- p-value
- 0
- Sample size (n)
- 252
- 95% confidence interval
- -0.5527 to -0.3573
- Granger causality
- None
- Granger optimal lag
- 1
AI analysis
Analysis: AAPL Opening Price vs. Cboe Total Shares Volume (2016)
Relationship Overview The scatterplot reveals a moderate negative relationship between Apple's daily opening price (X-axis) and total U.S. equity shares traded on Cboe exchanges (Y-axis) across 2016. As AAPL's opening price increases, total market share volume tends to decrease. This inverse pattern is consistent with a broadly understood market dynamic: higher equity prices — particularly in a bellwether stock like AAPL — often coincide with periods of lower overall trading activity, possibly reflecting calmer, more bullish market conditions where fewer shares need to change hands. The linear regression equation (y = -3.13E-08x + 120.554) quantifies this slope, indicating that each unit increase in AAPL's opening price is associated with a very small but consistent decline in total shares traded.
Correlation Strength and Statistical Significance The Pearson correlation of r = -0.4606 indicates a moderate negative association, but the explanatory power is notably limited: r² = 0.2121 means only ~21% of the variance in total Cboe share volume is explained by AAPL's opening price, leaving roughly 79% attributable to other factors. The 95% confidence interval of [-0.5527, -0.3573] is entirely negative and does not cross zero, reinforcing directional confidence. The p-value of 1.22 × 10⁻¹⁴ is overwhelmingly significant, confirming this is not a chance association given n = 252 paired observations. However, statistical significance here is partly a function of sample size — the practical magnitude of the effect is modest. Critically, Granger causality tests show no significant predictive directionality in either direction (X→Y: F = 1.06, p = 0.30; Y→X: F = 1.15, p = 0.28), meaning past values of AAPL's open do not meaningfully predict future Cboe volume, and vice versa. The relationship is correlational and contemporaneous rather than temporally predictive.
Patterns, Clusters, and Outliers Several features stand out in the sampled data. There is a visible cluster of observations concentrated in the $430M–$550M AAPL open price range, where Y (total shares) spreads widely from approximately 90 to 118, suggesting high variability at mid-range price levels. A few notable outliers appear: one point near (708M, 97) and another near (1.09B, ~100) sit far to the right of the main cluster, representing either data anomalies or genuinely extreme trading sessions. On the Y-axis, values near 90 and above 116 represent the volume extremes and don't cluster neatly with any single X region, hinting at non-linear or threshold behavior. The wide vertical spread at similar X values throughout the distribution weakens the case for a tight linear relationship.
Confounding Factors and Caveats Several important caveats apply. First, this is likely a spurious or proxy correlation — AAPL's opening price is being used as a proxy for broader market conditions (risk appetite, volatility regimes, macro events), not as a direct driver of Cboe volume. Both variables are likely co-driven by underlying market state variables such as the VIX, macroeconomic announcements, or Federal Reserve communications. Second, the axis labels appear swapped in context — the X-axis is labeled as an AAPL price column sourced from a Cboe dataset, and the Y-axis as a volume column from an S&P 500 dataset, which may indicate a data joining artifact requiring verification. Third, the data covers only one calendar year (2016), limiting generalizability; 2016 included specific macro events (Brexit, U.S. election) that may inflate or distort the observed relationship.
Actionable Insights and Further Investigation Given the moderate correlation and absent Granger causality, AAPL open price alone is insufficient as a predictor of market volume. Analysts should consider incorporating VIX (implied volatility), macroeconomic event calendars, and sector rotation indicators as additional covariates in a multivariate model. It would be valuable to test this relationship across multiple years to determine whether 2016 is representative or an outlier year. Investigating whether the relationship is driven by specific sub-periods (e.g., pre/post-election) through structural break tests (e.g., Chow test) could reveal regime-dependent dynamics. Finally, verifying the dataset join logic — given the apparent column source mismatch — should be a prerequisite before drawing any operational conclusions.
X dataset: Cboe U.S. Equities Historical Market Volume Data 2016
Y dataset: S&P 500 Index Daily OHLCV (Date)
Part of experiment: Daily - Cboe U.S. Equities Historical Market Volume Data 2016 vs S&P 500 Index Daily OHLCV (Date)