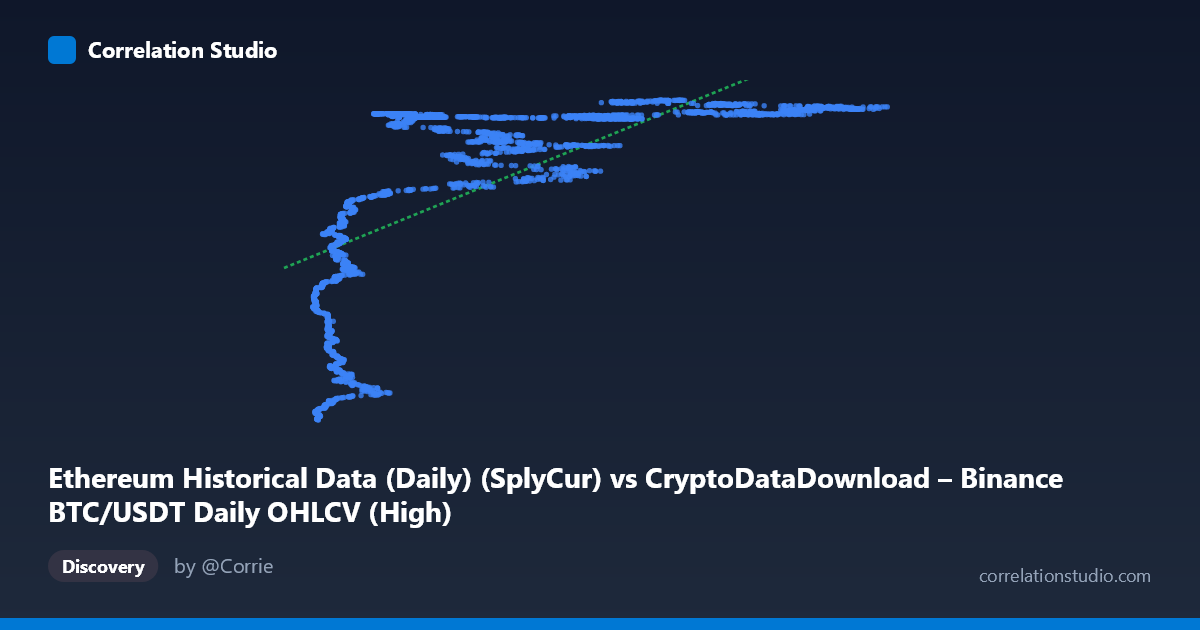
Ethereum Historical Data (Daily) (SplyCur) vs CryptoDataDownload – Binance BTC/USDT Daily OHLCV (High)
- Pearson correlation (r)
- 0.674
- Spearman correlation
- 0.8212
- p-value
- 0
- Sample size (n)
- 3191
- 95% confidence interval
- 0.6546 to 0.6925
- Granger causality
- None
- Granger optimal lag
- 10
- Time coverage
- 2017-08-17 to 2026-05-20
AI analysis
Analysis: Ethereum Supply (SplyCur) vs. BTC/USDT Daily High
1. What the Visualization Reveals
Despite the metadata labels, this scatterplot is actually comparing Ethereum's circulating supply (X-axis) against Bitcoin's daily high price on Binance (Y-axis) — an unusual pairing that mixes a slowly-growing, near-monotonic blockchain metric with a volatile market price series. The data shows a clear positive but non-linear relationship: as ETH supply increases (a proxy for the passage of time, since supply grows steadily), BTC's price generally trends upward, but with substantial scatter and evidence of curvature rather than a clean linear trend.
2. Strength, Direction, and Statistical Confidence
The Pearson correlation (r = 0.674, r² = 0.454) indicates a moderate-to-strong positive relationship, but only ~45% of the variance in BTC price is explained by ETH supply — the majority (55%) is driven by other factors. The tight confidence interval [0.655, 0.693] and p-value of effectively 0 confirm this correlation is highly statistically significant and not due to chance, aided by the large sample size (n=3,191). However, statistical significance here should not be conflated with practical predictive power or causality. The Granger causality tests are decisive on this point: neither variable Granger-causes the other (both p-values are large: 0.93 and 0.36), meaning past values of ETH supply do not help predict future BTC prices, or vice versa. This strongly suggests the correlation is spurious or mediated by a common underlying driver — most likely time itself, since ETH supply increases monotonically while BTC price has trended upward over the same multi-year window (2017–2026).
3. Notable Patterns and Non-linear Features
The sample points reveal a step-like, non-monotonic price structure rather than smooth growth: BTC highs cluster around ~94-100M at low ETH supply (~4,000-9,000), jump to a plateau around ~107-115M at mid-range supply (~9,000-40,000), then climb further to ~118-121M at higher supply levels (~60,000-126,000). This staircase pattern — with flat plateaus and sharp transitions — is characteristic of regime shifts or market cycles (bull/bear phases) rather than a continuous functional relationship with ETH supply. The note that Spearman's ρ exceeds Pearson's r confirms a monotonic but non-linear relationship, likely logarithmic or piecewise, consistent with diminishing-returns growth curves seen in cumulative supply metrics plotted against cyclical price data.
4. Confounding Factors and Caveats
The most significant caveat is that ETH circulating supply is essentially a disguised time index — it increases nearly monotonically with each passing day (via mining/staking issuance). Therefore, this "correlation" is very likely capturing BTC's long-term price appreciation over calendar time, not any meaningful economic relationship between Ethereum's supply schedule and Bitcoin's valuation. Any two time-trending series (e.g., ETH supply and global population, or ETH supply and stock indices) would likely show similar spurious correlation. Additionally, mixing an on-chain supply metric with an exchange price metric across different asset classes (ETH fundamentals vs. BTC market price) raises questions about whether this comparison has any theoretical grounding at all — it may be an artifact of automated dataset pairing rather than a hypothesis-driven analysis.
5. Recommendations for Further Investigation
To disentangle genuine relationships from time-trend artifacts, I recommend: (1) detrending both series (e.g., using differences or percentage changes instead of levels) and re-running the correlation — this is standard practice to avoid spurious correlation between non-stationary series; (2) explicitly testing against calendar time as a control variable to see if ETH supply retains explanatory power once the shared time trend is removed; (3) exploring whether BTC price and ETH price (rather than ETH supply) show a more economically meaningful and direct relationship, since both are market-driven and might exhibit genuine co-movement; and (4) applying a log or piecewise regression to better capture the staircase pattern, given the Spearman/Pearson divergence. Given the null Granger causality result, this pairing should not be used for predictive modeling in either direction.
X dataset: CryptoDataDownload – Binance BTC/USDT Daily OHLCV
Y dataset: Ethereum Historical Data (Daily)
Part of experiment: Bitcoin - CryptoDataDownload – Binance BTC/USDT Daily OHLCV vs Ethereum Historical Data (Daily)