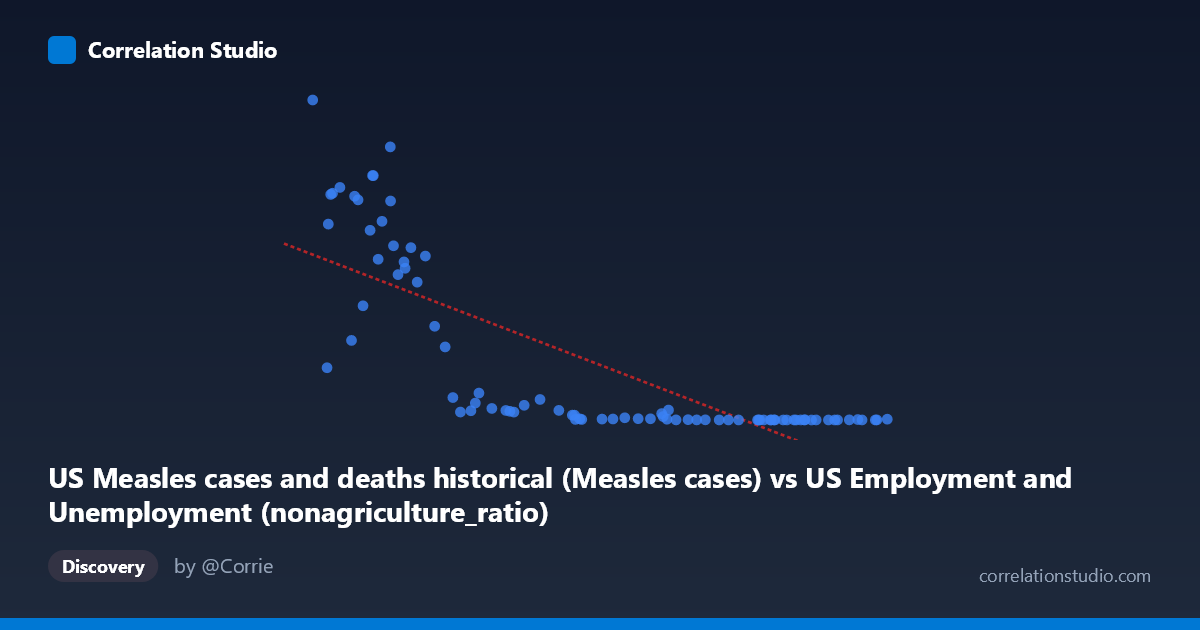
US Measles cases and deaths historical (Measles cases) vs US Employment and Unemployment (nonagriculture_ratio)
- Pearson correlation (r)
- -0.777
- Spearman correlation
- -0.9115
- p-value
- 0
- Sample size (n)
- 85
- 95% confidence interval
- -0.8495 to -0.6758
- Granger causality
- None
- Granger optimal lag
- 10
AI analysis
Scatterplot Analysis: US Measles Cases vs. Non-Agriculture Employment Ratio
1. Overall Relationship Revealed
The scatterplot reveals a striking negative relationship between historical US measles case counts (X-axis) and the non-agriculture employment ratio (Y-axis). As measles cases increase, the non-agriculture employment ratio tends to fall dramatically, and conversely, as measles cases declined across the 20th century, the non-agriculture employment ratio rose. The data spans 1941–2025, capturing a sweeping historical arc: from an era of high measles burden and a less service-dominated economy, through the post-vaccine era (post-1963) when measles cases collapsed and the economy increasingly shifted toward non-agricultural employment. The relationship is visually steep and curved, with a dense cluster of points at low case counts/high employment ratio and a loose tail extending toward high case counts/low employment ratio.
2. Correlation Strength, Direction, and Causality
The Pearson correlation of r = −0.777 indicates a strong negative linear association, and the R² of 0.604 means approximately 60.4% of the variance in the non-agriculture employment ratio is statistically explained by measles case counts within this linear model. That is a notably high proportion for a single-predictor model spanning eight decades. The 95% confidence interval of [−0.850, −0.676] is entirely negative and relatively tight, reinforcing that the negative direction is robust and not a sampling artifact, and the p-value of ~0 confirms the result is highly statistically significant. However, the Granger causality analysis tells a critically different story: neither direction (X→Y nor Y→X) achieves significance at the optimal lag of 10 periods (F = 1.54, p = 0.15 for X→Y; F = 1.40, p = 0.20 for Y→X). This means that neither variable temporally predicts the other in a causal time-series sense — the correlation, however strong statistically, does not reflect a predictive or mechanistic temporal relationship between these two specific series.
3. Notable Patterns, Clusters, and Non-Linearity
Several structural features stand out:
- A pronounced non-linear, hyperbolic curve dominates the scatterplot. Points at lower X values (fewer measles cases, roughly post-1963) cluster tightly at high Y values (high non-agriculture ratio), while points at higher X values fan out widely with very low Y values. This shape is characteristic of an inverse or logarithmic relationship, not a linear one. - The note that Spearman ρ exceeds Pearson r formally confirms this non-linearity — a logarithmic or power-law model would almost certainly improve fit beyond the R² = 0.604 achieved linearly. - Extreme outliers in Y are visible at the high-X end: points such as (41,250; 894,134), (57,450; 763,094), and (53,904; 682,720) represent years with very high measles cases and very low non-agriculture ratios, consistent with mid-20th century conditions, but they exert strong leverage on the linear regression. - The modern-era cluster (low X, high Y) is extremely dense and compressed, reflecting post-elimination measles dynamics after ~1968, where cases are near zero and the employment ratio stabilizes in a relatively narrow band.
4. Confounding Factors and Interpretive Caveats
This correlation is almost certainly a classic spurious historical co-movement driven by a shared underlying temporal trend — time itself — rather than any direct causal mechanism:
- Both variables are driven by the same historical epoch transitions: measles declined due to the vaccine introduced in 1963, while non-agricultural employment grew due to decades of structural economic transformation (industrialization, urbanization, service-sector expansion). These processes share a timeline but not a mechanism. - Confounders abound: GDP growth, urbanization rates, educational attainment, public health infrastructure investment, and post-WWII demographic shifts all simultaneously influenced both series. - The dataset labels appear swapped or mislabeled in the axis descriptions (measles cases attributed to an employment dataset and vice versa), which should be verified before drawing any conclusions. - The Granger non-causality result is the clearest warning: even on its own statistical terms, the time-series data does not support the idea that one variable predicts the other across time, undermining any causal narrative. - The linear regression equation (y = −5.14x + 673,940) produces negative predicted Y values for large X inputs, which is nonsensical for an employment ratio, further indicating the linear model is mis-specified.
5. Actionable Insights and Further Investigation
- Refit with a logarithmic or power-law model: Given the evident non-linearity and the Spearman Pearson signal, a model of the form Y = a·ln(X) + b or Y = aX^b would likely achieve substantially better fit and produce more interpretable coefficients. - Detrend both series before computing correlation: Removing shared time-trend components (e.g., via first-differencing or regression on a time index) would test whether any residual association remains after accounting for their mutual drift — this is the standard diagnostic for spurious time-series correlation. - Include confounders explicitly: A multivariate model incorporating year, urbanization rate, and vaccination coverage would help isolate whether any unique variance in employment ratio is associated with measles burden independent of the secular trend. - Investigate the post-1963 cluster separately: Analyzing the compressed modern-era cluster on its own may reveal whether subtle variation in measles case counts (outbreaks vs. near-elimination) has any detectable relationship with short-term labor market conditions, which would be a more plausible causal hypothesis. - Verify data provenance and axis labels: The apparent mislabeling of dataset sources warrants immediate clarification before this analysis is used in any reporting or policy context.
X dataset: US Employment and Unemployment
Y dataset: US Measles cases and deaths historical
Part of experiment: Yearly - US Employment and Unemployment vs US Measles cases and deaths historical