NOAA ISD Weather Station History (Lat/Lon Index) (WDSP_ATTRIBUTES) vs CryptoDataDownload – Binance BTC/USDT Daily OHLCV (Close)
- Pearson correlation (r)
- -0.4701
- Spearman correlation
- -0.3044
- p-value
- 0
- Sample size (n)
- 355
- 95% confidence interval
- -0.5474 to -0.3848
- Granger causality
- None
- Granger optimal lag
- 1
AI analysis
Analysis of the Scatterplot Relationship
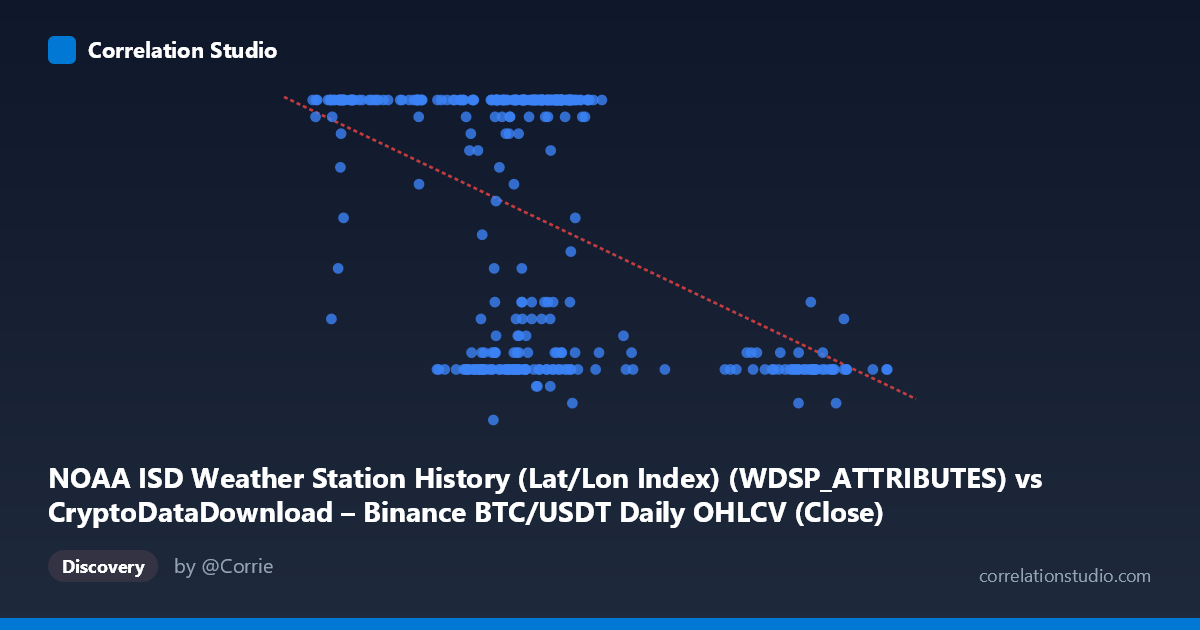
1. Overall Pattern The scatterplot shows a moderate negative relationship between the X variable (labeled as a weather station index, though the values 39,568–106,133 and their pairing with BTC/USDT close prices suggest a likely column-mapping mismatch in the metadata) and Y (ranging 5–24). As X increases, Y tends to decrease, but the relationship is far from a clean linear trend — there's substantial scatter and what appears to be clustering behavior rather than a smooth decline.
2. Strength, Direction, and Statistical Confidence The correlation coefficient (r = -0.470) indicates a moderate negative relationship. However, r² = 0.221 tells the more important story: only 22% of the variance in Y is explained by X, leaving 78% attributable to other factors, noise, or non-linear dynamics not captured by this linear model. The 95% CI [-0.547, -0.385] is reasonably tight and does not cross zero, and the p-value (~0) confirms this correlation is statistically significant and not due to chance at this sample size (n=355). That said, statistical significance with large n is common even for modest effect sizes — the practical explanatory power remains limited. Critically, the Granger causality tests show no significant predictive direction in either direction (X→Y: p=0.58; Y→X: p=0.27), meaning that despite the contemporaneous correlation, neither variable meaningfully helps forecast the other's future values at lag 1. This suggests the relationship is either coincidental, driven by a shared external factor, or structural rather than temporal/dynamic.
3. Notable Patterns and Outliers The data reveals a distinctive clustering pattern rather than a continuous linear spread. Many points cluster tightly at Y=24 (the apparent ceiling) across a wide X range (~41,000–71,000), suggesting a possible censoring/capping effect at the upper bound. Separately, there's a dense cluster of low Y values (7–12) concentrated in the X range of 60,000–73,000, and another cluster of low Y values (8–9) at higher X values (89,000–101,000). This bimodal/clustered structure — rather than a smooth linear decay — suggests the negative correlation may be an artifact of two or more overlapping subpopulations (e.g., different regimes or categories) rather than a true continuous inverse relationship.
4. Confounding Factors and Caveats The metadata is suspicious: X is labeled as a weather station lat/lon index while Y is labeled as BTC/USDT closing price, but the axis descriptions have been swapped/mismatched with the dataset notes. If Y is actually a bounded/discrete variable (values cluster at integers like 24, 23, 22...), it may represent something like a categorical rating, day-count, or index rather than a continuous price — this would explain the ceiling effect at 24. Time coverage (Jan–Dec 2024) implies both series may simply share a common time trend (seasonality, trend drift) that creates spurious correlation without any causal link — a classic case of confounding by an omitted time-varying factor. Given the lack of Granger causality, this spurious-correlation-via-shared-trend explanation is more plausible than a genuine driving relationship.
5. Recommendations First, verify and correct the axis/column labeling, since the current mismatch (crypto price vs. weather station index) undermines interpretability. Second, investigate the apparent ceiling at Y=24 and clustering structure with a categorical or piecewise model rather than assuming linearity — a segmented regression or clustering analysis (e.g., Gaussian mixture) may reveal distinct regimes driving the correlation. Third, since Granger tests show no lagged predictive value, consider testing for contemporaneous confounders (e.g., detrending both series or including calendar/seasonal controls) before drawing causal conclusions. Finally, given r² of only 22%, this relationship alone offers limited standalone predictive utility — additional features should be incorporated into any forecasting model.
X dataset: CryptoDataDownload – Binance BTC/USDT Daily OHLCV
Y dataset: NOAA ISD Weather Station History (Lat/Lon Index)
Part of experiment: Bitcoin - CryptoDataDownload – Binance BTC/USDT Daily OHLCV vs NOAA ISD Weather Station History (Lat/Lon Index)