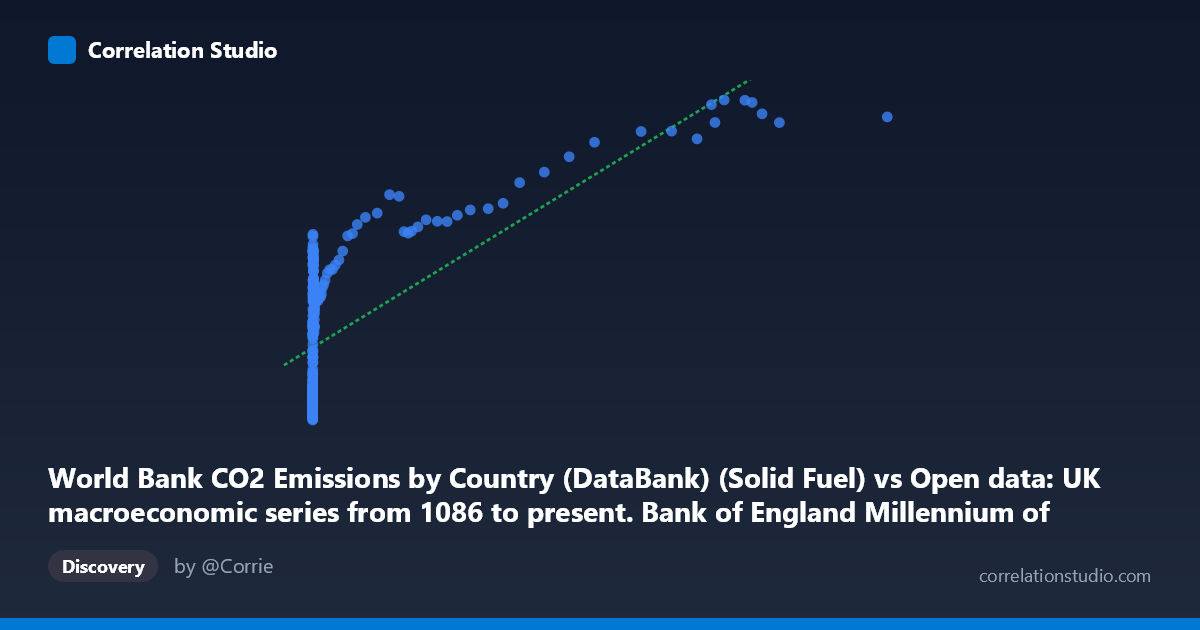
World Bank CO2 Emissions by Country (DataBank) (Solid Fuel) vs Open data: UK macroeconomic series from 1086 to present. Bank of England Millennium of Macroeconomic Data. (Month) (value)
- Pearson correlation (r)
- 0.6978
- Spearman correlation
- 0.8952
- p-value
- 0
- Sample size (n)
- 267
- 95% confidence interval
- 0.6306 to 0.7546
- Granger causality
- Y → X
- Granger optimal lag
- 10
- Time coverage
- 1751-01-01 to 2017-01-01
AI analysis
Analysis: UK Solid Fuel CO2 Emissions vs. UK Macroeconomic Value
1. What the Visualization Reveals
The scatterplot displays the relationship between UK solid fuel CO2 emissions (X-axis, sourced from World Bank data) and a UK macroeconomic indicator from the Bank of England's Millennium dataset (Y-axis), spanning 1751–2017. The plot immediately reveals a broadly positive but highly non-linear relationship: Y values rise relatively steeply at low X values and then flatten into a plateau as X increases, suggesting a logarithmic or asymptotic curve rather than a straight line. The data is heavily right-skewed on the X-axis, with most observations clustered at low emissions values and a long tail of extreme outliers stretching to ~116,836 units, which strongly compresses the visual distribution and likely reflects the dramatic industrialization arc of the UK economy over nearly three centuries.
2. Correlation Strength, Direction, and Causality
The Pearson correlation of r = 0.698 indicates a moderate-to-strong positive association, but the linear regression explains only 48.7% of variance in Y (R² = 0.487), meaning more than half of Y's variation is driven by factors beyond solid fuel emissions alone. The 95% confidence interval [0.631, 0.755] is reasonably tight and excludes zero, and the p-value of effectively 0 confirms this is not a chance finding across the n=267 paired observations. Critically, the Spearman ρ exceeds Pearson r, which is a diagnostic flag that the true relationship is non-linear — a logarithmic or polynomial fit would almost certainly explain substantially more variance than the current linear model. The Granger causality results add an important temporal dimension: Y Granger-causes X (F=1.986, p=0.036) with a 10-period lag, while X does not Granger-cause Y (p=0.367). This means the macroeconomic indicator has historically preceded changes in solid fuel emissions, not the reverse — economic conditions appear to drive energy/emissions behavior, rather than emissions driving economic output, at least at this lag structure.
3. Notable Patterns, Clusters, and Outliers
Several structural features stand out in the sample points. There is a dense cluster of observations at very low X values (roughly X < 10) where Y spans a wide range (~1,434–5,270), suggesting high macroeconomic variability during early pre-industrial periods with minimal emissions. A second mid-range cluster (X ≈ 26–686) shows Y values concentrated between ~7,000–18,700, consistent with the industrialization era. At the high end, extreme X outliers — including X = 116,836 (Y ≈ 29,581), X = 47,087 (Y ≈ 24,455), and X = 35,690 (Y ≈ 21,062) — correspond to peak industrial-era emissions and high macroeconomic values, but these points show diminishing marginal returns in Y relative to X, reinforcing the non-linear plateau hypothesis. The flattening at high X suggests that beyond a certain emissions threshold, additional fossil fuel consumption no longer corresponds to proportional economic gains — consistent with efficiency transitions or post-industrial structural shifts.
4. Confounding Factors and Caveats
Several important caveats apply. First, this is a temporal correlation spanning 266 years, meaning both variables are likely driven by a common underlying trend — long-run economic and population growth — rather than a direct causal mechanism between them. This is a classic spurious correlation risk in time-series analysis. Second, the macroeconomic Y variable is not precisely identified in the metadata ("value" from the BoE dataset), which could represent GDP, wages, money supply, or another indicator — the interpretation changes substantially depending on which it is. Third, omitted variable bias is significant: industrialization, population growth, technological change, and trade patterns all co-move with both variables over this period. Fourth, the X-axis data represents solid fuel emissions only, excluding liquid fuels and gas, which became increasingly dominant post-1950, potentially truncating the relationship in the modern era. Finally, mixing monthly and annual data frequencies (noted in the dataset descriptions) introduces potential temporal aggregation errors.
5. Actionable Insights and Further Investigation
The Granger causality finding — that economic conditions precede emissions — is the most actionable insight here and warrants deeper investigation. Researchers should: (1) refit the model using a logarithmic transformation of X (log of solid fuel emissions) given the Spearman Pearson signal, which will likely push R² substantially above 50% and yield more meaningful coefficients; (2) identify the specific BoE macroeconomic variable being correlated and test the relationship separately across distinct economic eras (pre-industrial, industrial, post-WWII, modern); (3) apply cointegration tests (e.g., Engle-Granger) since both series appear non-stationary over this horizon, and the Granger results may be sensitive to unit roots; (4) expand the emissions variable to include total fossil fuel emissions rather than solid fuel alone to test whether the relationship strengthens; and (5) explore the 10-period lag structure in the Granger model to determine whether it corresponds to meaningful policy or investment cycles in UK economic history.
X dataset: Open data: UK macroeconomic series from 1086 to present. Bank of England Millennium of Macroeconomic Data. (Month)
Y dataset: World Bank CO2 Emissions by Country (DataBank)
Part of experiment: Yearly - Open data: UK macroeconomic series from 1086 to present. Bank of England Millennium of Macroeconomic Data. (Month) vs World Bank CO2 Emissions by Country (DataBank)