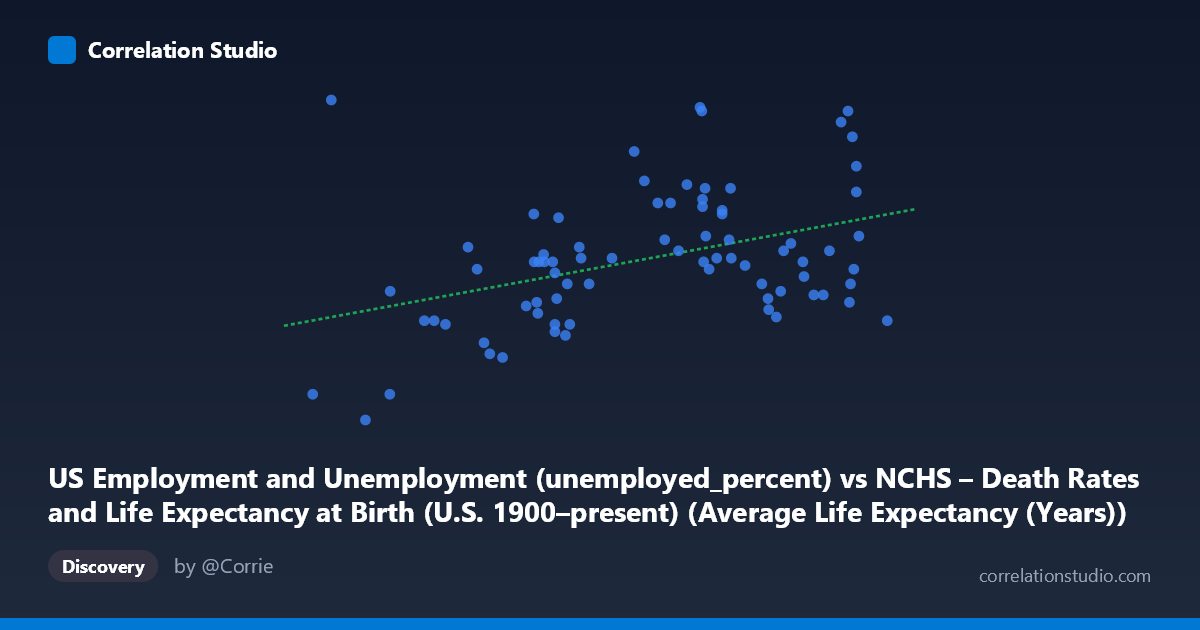
US Employment and Unemployment (unemployed_percent) vs NCHS – Death Rates and Life Expectancy at Birth (U.S. 1900–present) (Average Life Expectancy (Years))
- Pearson correlation (r)
- 0.4029
- Spearman correlation
- 0.3659
- p-value
- 0.000255
- Sample size (n)
- 78
- 95% confidence interval
- 0.1982 to 0.574
- Granger causality
- X → Y
- Granger optimal lag
- 2
- Time coverage
- 1941-01-01 to 2018-01-01
AI analysis
Analysis: US Unemployment Rate vs. Life Expectancy (1941–2018)
Relationship Overview
The scatterplot reveals a modest positive relationship between the US unemployment rate (X-axis) and average life expectancy (Y-axis) across the period 1941–2018. The linear regression equation (y = 0.164x − 6.145) suggests that higher unemployment is associated with longer life expectancy — a counterintuitive finding that immediately signals the presence of confounding dynamics. This pattern, sometimes called the "mortality-recession paradox," has been documented in public health literature and reflects complex societal mechanisms that defy simple economic intuition. The visualization shows considerable scatter around the regression line, with data points spread across a wide range of unemployment values (roughly 2–10%) and life expectancy values (roughly 2–10 years of gain over the baseline period).
Correlation Strength and Statistical Significance
The correlation of r = 0.40 indicates a weak-to-moderate positive association, with r² = 0.162 meaning that unemployment rate explains only about 16.2% of the variance in life expectancy — leaving roughly 84% attributable to other factors. The 95% confidence interval of [0.198, 0.574] confirms that the true correlation is statistically distinguishable from zero but could range from quite weak to moderately strong, reflecting meaningful uncertainty. The p-value of 0.00025 establishes high statistical significance given the sample size (n = 78), so the relationship is unlikely to be a chance artifact. Crucially, the Granger causality analysis supports a unidirectional temporal predictive relationship: unemployment Granger-causes life expectancy (F = 3.58, p = 0.033) with an optimal lag of 2 periods (years), while the reverse direction is not supported (p = 0.693). This suggests unemployment trends may have predictive power for life expectancy trajectories roughly 2 years forward, though Granger causality does not establish true causal mechanisms.
Notable Patterns, Clusters, and Outliers
Several notable features are visible in the scatter. There is a cluster of points at lower unemployment values (2–4%) paired with moderate-to-low life expectancy gains, corresponding likely to the post-WWII boom era. A second cluster appears at mid-range unemployment (5–7%) with higher life expectancy values, likely reflecting the 1970s–1990s period when both unemployment was elevated and life expectancy was improving substantially due to medical advances. Several prominent outliers deserve attention: the point near (61.7, 9.9) shows very low unemployment paired with exceptionally high life expectancy — potentially a wartime anomaly — while (77.5, 9.6) and (77.6, 9.7) show high unemployment also paired with high life expectancy, consistent with the recession-mortality paradox. The point at (62.8, 1.2) represents the lowest life expectancy value and sits far from the main cluster, suggesting an unusual early-period observation. The wide vertical spread at any given X value underscores that unemployment alone is a poor predictor of life expectancy.
Confounding Factors and Caveats
Several important confounders complicate interpretation. First, long-term secular trends dominate both variables: life expectancy has trended upward throughout the 20th century due to medical advances, sanitation, and public health improvements, while unemployment fluctuates cyclically — conflating trend with correlation. Second, the mortality-recession paradox (Tapia Granados et al.) suggests that during recessions, reduced industrial activity, less driving, and slower work pace may temporarily reduce accident and cardiovascular mortality, masking the long-term harm of unemployment. Third, these are population-level aggregates, masking distributional inequality — unemployment and life expectancy improvements are not uniformly distributed across race, sex, or socioeconomic class. Fourth, the 2-year Granger lag may simply reflect the time delay between economic downturns and their health consequences, rather than a direct mechanism. Finally, using annual national-level data over 77 years means the effective degrees of freedom may be lower than n = 78 suggests due to strong autocorrelation in both series.
Actionable Insights and Further Investigation
Despite the counterintuitive direction, these findings merit serious follow-up. Researchers should decompose the time series by detrending both variables to separate secular trends from cyclical correlations — this would clarify whether the positive association survives or reverses once the long-run upward trend in life expectancy is removed. Stratified analysis by race, sex, and age group would reveal whether the aggregate masks opposing effects for different populations, particularly since unemployment hits disadvantaged groups harder. Extending the Granger causality analysis with longer lag structures and controlling for GDP, healthcare expenditure, and medical innovation indices would sharpen causal inference. Comparing findings with county- or state-level panel data would provide greater statistical power and help distinguish ecological from individual-level effects. Finally, incorporating cause-specific mortality (e.g., cardiovascular, suicide, drug overdose) as outcome variables could illuminate the mechanisms through which economic conditions influence population health trajectories.
X dataset: NCHS – Death Rates and Life Expectancy at Birth (U.S. 1900–present)
Y dataset: US Employment and Unemployment
Part of experiment: Yearly - NCHS – Death Rates and Life Expectancy at Birth (U.S. 1900–present) vs US Employment and Unemployment