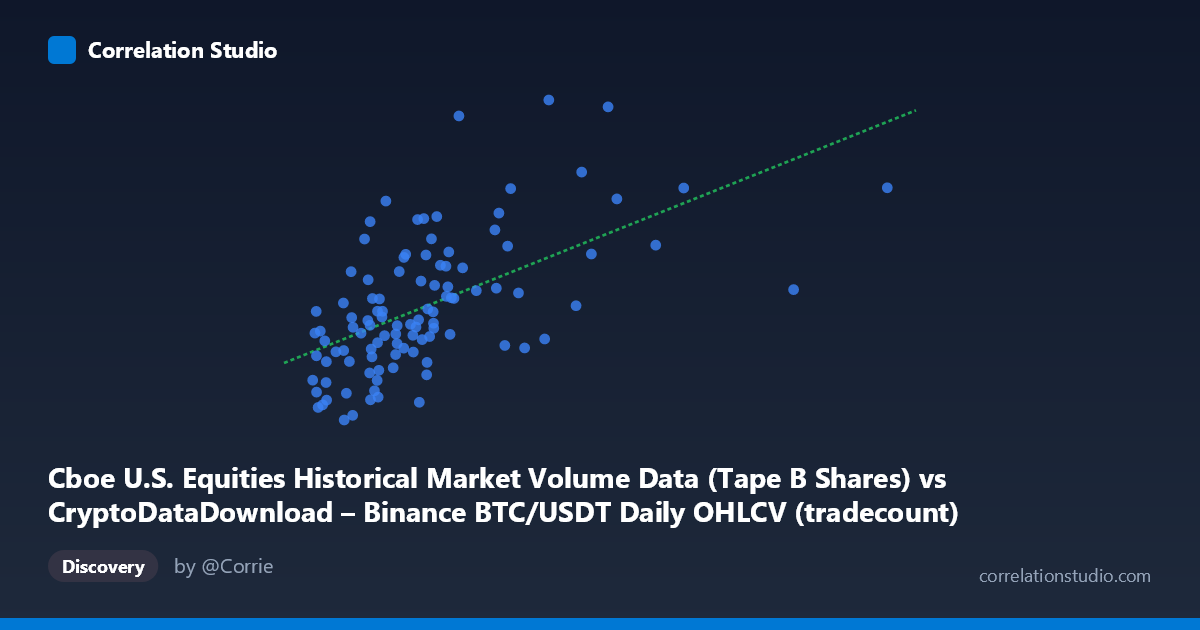
Cboe U.S. Equities Historical Market Volume Data (Tape B Shares) vs CryptoDataDownload – Binance BTC/USDT Daily OHLCV (tradecount)
- Pearson correlation (r)
- 0.6382
- Spearman correlation
- 0.7033
- p-value
- 0
- Sample size (n)
- 90
- 95% confidence interval
- 0.4968 to 0.7466
- Granger causality
- None
- Granger optimal lag
- 10
AI analysis
Analysis: Cboe Equities Volume vs. Binance BTC/USDT Trade Count
1. Overall Relationship The scatterplot shows a moderate positive linear relationship between the two variables. As the X variable (Cboe Tape B share volume) increases, the Y variable (Binance BTC/USDT tradecount) tends to increase as well, though with considerable scatter around the trend line. The data does not form a tight, cigar-shaped cluster typical of strong correlations; instead, points spread widely at nearly every X value, particularly in the dense cluster between X = 2.3M–6M, where Y ranges from roughly 140M to nearly 400M.
2. Strength, Direction, and Uncertainty The correlation coefficient (r = 0.638) indicates a moderate positive association, with r² = 0.407 meaning only about 41% of the variance in Y is statistically explained by X — the majority (59%) is driven by other factors or noise. The 95% confidence interval [0.497, 0.747] is reasonably tight and entirely positive, and the p-value (1.32E-11) is highly significant, confirming this correlation is very unlikely to be due to chance in this sample. However, statistical significance should not be conflated with practical predictive strength: r² of 0.41 leaves substantial unexplained variance. Critically, the Granger causality tests (p = 0.80 and p = 0.77 in both directions) show no evidence of temporal predictive causality in either direction. This means that despite the contemporaneous correlation, past values of one series do not help forecast future values of the other — the relationship is likely coincidental co-movement (e.g., both trending upward over the same calendar period) rather than a lead-lag dynamic.
3. Patterns and Outliers Several points deviate from the general trend, most notably (7648119, 393280831) and (5598749, 380486552) and (8998829, 387766295), which sit well above the regression line — high Y values despite moderate X values. Conversely, low-Y outliers like (2982889, 136794675) and (3176308, 140550023) show low Y paired with low X, consistent with the trend. The bulk of the data clusters in a tight X range (2M–8M) with a few high-leverage points extending to X = 15.36M (e.g., 15364010, 322931789), which could disproportionately influence the slope estimate. No strong non-linear curvature (e.g., logarithmic or exponential bending) is visually apparent; a linear fit seems reasonably appropriate, though the wide vertical scatter at low X suggests heteroscedasticity (variance in Y increases at lower X values).
4. Confounding Factors and Caveats This pairing is inherently unusual: X is equity market (Cboe Tape B) share volume, and Y is Binance crypto trade count — two structurally different markets. Any correlation is more likely explained by shared temporal trends (both series may be rising over the Jan–May 2026 window due to general market growth, seasonality, or macro liquidity conditions) rather than a direct economic mechanism linking equity volume to crypto trading activity. The lack of Granger causality reinforces that this is likely a spurious or confounded correlation — potentially driven by a third factor such as overall market volatility, risk sentiment, or trading-day effects that push both variables together without one causing the other. Additionally, n = 90 is a small sample relative to the full population (N = 1,980), and daily financial data often exhibits autocorrelation, which can inflate apparent correlation r values.
5. Recommendations Given the absence of Granger causality, this correlation should not be used for predictive trading or forecasting purposes. Instead, investigate whether both series correlate with a common macro variable (e.g., VIX, overall crypto market cap, or risk-on/risk-off sentiment indices) — testing for confounders directly could clarify if this is a genuine spurious correlation. Extending the time window beyond ~4.5 months and re-running Granger tests with additional lag structures may also help since 10-period lag came back insignificant. Finally, robustness checks (e.g., removing the high-leverage X=15.36M point, log-transforming both variables, and testing for heteroscedasticity) would help confirm whether the r²=0.41 finding is stable or driven by a handful of extreme observations.
X dataset: CryptoDataDownload – Binance BTC/USDT Daily OHLCV
Y dataset: Cboe U.S. Equities Historical Market Volume Data
Part of experiment: Bitcoin - CryptoDataDownload – Binance BTC/USDT Daily OHLCV vs Cboe U.S. Equities Historical Market Volume Data