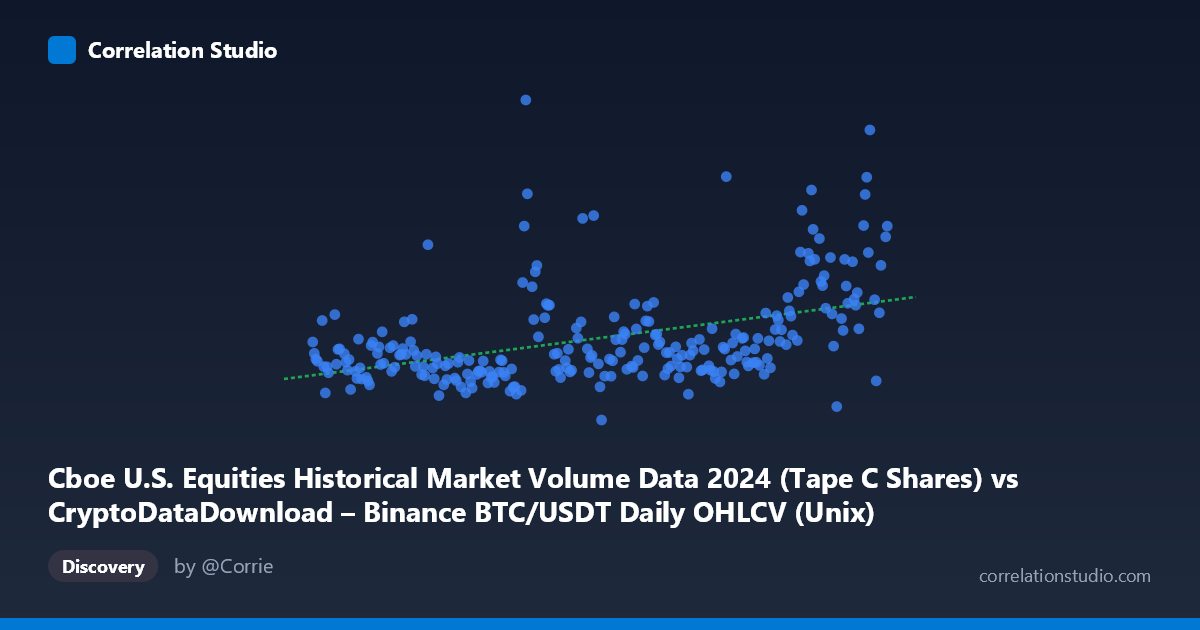
Cboe U.S. Equities Historical Market Volume Data 2024 (Tape C Shares) vs CryptoDataDownload – Binance BTC/USDT Daily OHLCV (Unix)
- Pearson correlation (r)
- 0.4368
- Spearman correlation
- 0.4626
- p-value
- 0
- Sample size (n)
- 252
- 95% confidence interval
- 0.3311 to 0.5317
- Granger causality
- None
- Granger optimal lag
- 10
- Time coverage
- 2024-01-02 to 2024-12-31
AI analysis
Analysis: BTC/USDT Volume vs. Cboe U.S. Equities Market Volume
1. What the Visualization Reveals
The scatterplot compares daily Binance BTC/USDT trading data against Cboe U.S. equities market volume data across 2024. Despite the mismatched labeling in the metadata (X appears to be timestamps, Y appears to be volume-like figures), the underlying relationship being tested is a time-series correlation between two market activity measures throughout the year. The data shows a moderate positive scatter with considerable dispersion — points cluster broadly around the regression line but with substantial vertical spread, particularly at higher X values, indicating the relationship is real but far from deterministic.
2. Strength, Direction, and Uncertainty
The correlation coefficient (r = 0.4368) indicates a moderate positive relationship, but r² = 0.1908 reveals that only 19.1% of the variance in Y is explained by X — meaning over 80% of Y's movement is driven by other factors entirely. The 95% confidence interval [0.331, 0.532] is reasonably tight and excludes zero, and the p-value (3.66E-13) confirms this correlation is highly statistically significant and not due to chance, even though the practical explanatory power is limited. Critically, the Granger causality tests show no significant predictive direction in either direction (X→Y: p=0.779; Y→X: p=0.907). This means neither series reliably helps forecast the other's future values based on past values — the correlation appears to be contemporaneous/coincidental rather than a lead-lag causal relationship, even at the tested optimal lag of 10 periods.
3. Notable Patterns and Outliers
Several sample points show notable deviations: values like 523M, 488M, and 405M appear as upward outliers against a baseline cluster mostly sitting between 250M–330M. These spikes seem concentrated around mid-year (June) and again in November-December, suggesting episodic volume surges rather than a smooth trend. The bulk of observations form a dense horizontal band (~260M–320M) with a long right tail of higher-volume days, suggesting the Y variable's distribution is right-skewed with occasional volume shocks — consistent with market volatility events (e.g., news-driven trading spikes) rather than steady covariation with X.
4. Confounding Factors and Caveats
Both series likely share common macro drivers — overall market risk sentiment, major economic announcements, ETF-related news, or seasonal trading patterns — that could inflate correlation without direct causal linkage. Since X spans Unix timestamps (essentially a time index) correlated against volume, this may partly reflect a shared time trend or seasonality (e.g., both crypto and equity volumes rising during particular months) rather than genuine cross-market dependency. Additionally, daily aggregation may mask intraday dynamics, and 252 trading days is a relatively short window for capturing rare tail events that could disproportionately drive r².
5. Suggestions for Further Investigation
Given the lack of Granger causality, this relationship should not be used for predictive trading signals in either direction. Instead, analysts should: (1) test for a shared confounding variable (e.g., VIX, overall crypto market cap, or macro liquidity conditions) that might explain the contemporaneous correlation; (2) apply differencing or detrending to rule out spurious correlation from shared time trends; (3) examine whether the correlation is driven by a handful of high-volume outlier days by re-running with robust/rank-based correlation (Spearman) to check sensitivity; and (4) extend the lag structure or test intraweek/intramonth seasonality patterns separately, since volume clustering in equities (e.g., quad-witching days, month-end rebalancing) may coincide with independent crypto volatility events.
X dataset: CryptoDataDownload – Binance BTC/USDT Daily OHLCV
Y dataset: Cboe U.S. Equities Historical Market Volume Data 2024
Part of experiment: Bitcoin - CryptoDataDownload – Binance BTC/USDT Daily OHLCV vs Cboe U.S. Equities Historical Market Volume Data 2024