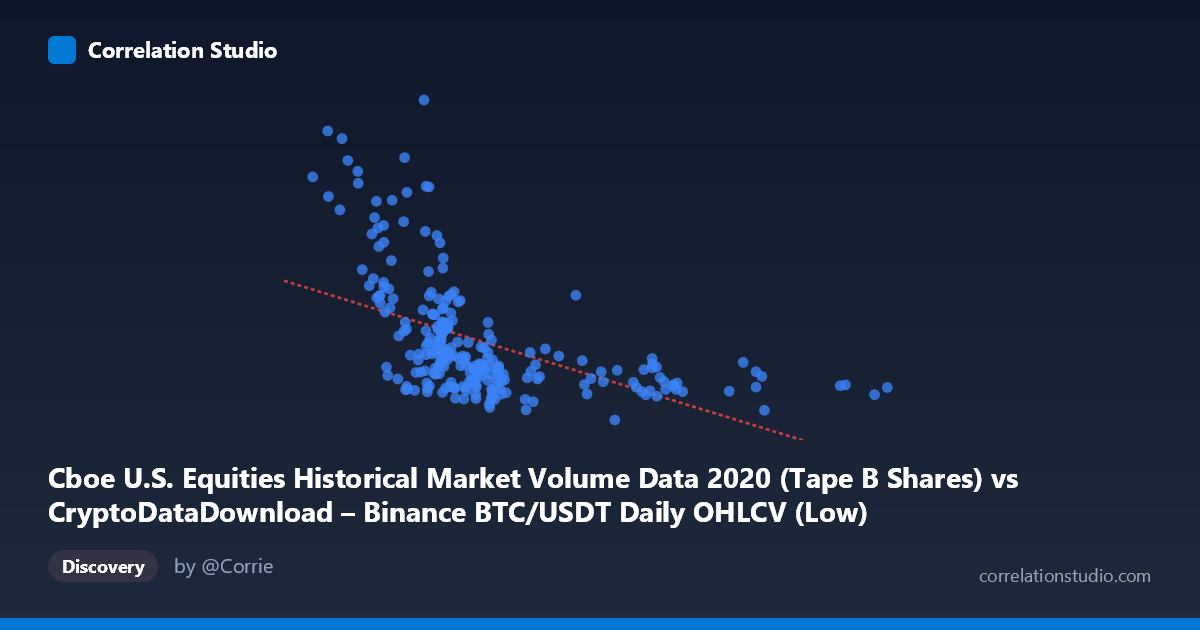
Cboe U.S. Equities Historical Market Volume Data 2020 (Tape B Shares) vs CryptoDataDownload – Binance BTC/USDT Daily OHLCV (Low)
- Pearson correlation (r)
- -0.5151
- Spearman correlation
- -0.6615
- p-value
- 0
- Sample size (n)
- 253
- 95% confidence interval
- -0.6003 to -0.4184
- Granger causality
- None
- Granger optimal lag
- 10
AI analysis
Analysis: Cboe Equities Volume vs. BTC/USDT Daily Low Price (2020)
1. What the Visualization Reveals
The scatterplot shows a moderate inverse relationship between U.S. equities market volume (Tape B shares) and Bitcoin's daily low price. As equities trading volume increases, Bitcoin's price tends to decrease — though the relationship is noisy rather than a clean linear trend. The data cloud shows a dense cluster of points in the lower-X, mid-Y range (roughly 7,000–12,000 volume, $80M–$160M price), with a sparser tail of higher-volume observations (15,000–28,000) that consistently correspond to lower, more stable BTC prices ($70M–$100M). This asymmetric distribution suggests two distinct market regimes rather than one continuous linear process.
2. Strength, Direction, and Statistical Confidence
With r = -0.5151 and r² = 0.2653, only about 26.5% of the variance in Bitcoin's price is statistically associated with equities volume — a moderate correlation, but one leaving nearly three-quarters of price variation unexplained by this single variable. The 95% CI [-0.600, -0.418] is reasonably tight and excludes zero, and the p-value (effectively 0) confirms this correlation is highly unlikely to be due to chance in this sample. However, statistical significance here reflects sample size and consistency, not necessarily practical/predictive strength.
Critically, the Granger causality tests show no significant predictive direction in either direction (X→Y: p=0.888; Y→X: p=0.137). This means neither variable meaningfully helps forecast the other's future values when accounting for their own past values — despite the contemporaneous correlation. This is a classic case where two variables move together (or apart) without one temporally driving the other, suggesting the relationship may be driven by a shared external factor rather than direct causation in either direction.
3. Notable Patterns and Outliers
Several points stand out as extreme outliers, particularly (8445, 341.7M) and (3782, 271M) — both showing anomalously high BTC lows at relatively low/minimum equities volumes. Other high-Y outliers include (7590, 229.8M), (6762, 210.8M), and (5688, 265.1M), all clustered at low X-values. These suggest a nonlinear, possibly power-law or logarithmic decay: price appears to drop sharply as volume increases from low levels, then flattens into a stable low-price plateau at high volume (visible in the 17,000–28,000 range, where Y consistently sits near $75–100M). This is consistent with the note that Spearman ρ exceeds Pearson r — indicating the true relationship is likely curvilinear rather than linear, with the linear model potentially underestimating the strength of association in the lower-volume region.
4. Confounding Factors and Caveats
This pairing is unusual: it correlates a crypto exchange metric (BTC/USDT price) with a traditional equities volume metric (Cboe Tape B) — two markets with different participants, hours, and settlement mechanisms. Any correlation is almost certainly spurious or mediated by a third factor, most plausibly macro-level 2020 volatility events (COVID-19 crash in March, subsequent stimulus-driven rallies) that simultaneously affected both equity trading activity and crypto prices. Time is a strong confound here: 2020 had extraordinary, non-stationary volatility regimes, meaning both series may be trending/co-moving due to calendar-driven market stress rather than any direct economic link. Additionally, small-sample outliers (particularly the extreme Y values $200M) may be disproportionately influencing the linear correlation estimate.
5. Suggestions for Further Investigation
1. Test nonlinear models (log-log, polynomial, or spline regression) given the Spearman/Pearson divergence — this could substantially improve explained variance. 2. Control for time/volatility regime explicitly (e.g., segment by pre/post-March 2020 crash) to check if the correlation is driven by a specific crisis period rather than a stable year-round relationship. 3. Introduce a mediating variable, such as the VIX or a crypto volatility index, to test whether both series are jointly responding to systemic risk sentiment. 4. Given the lack of Granger causality, treat this as a contemporaneous/coincidental association, not a forecasting signal — avoid using equities volume as a leading indicator for BTC price without further causal evidence. 5. Winsorize or examine outliers separately, as a handful of extreme BTC-price days may be inflating the apparent linear correlation strength.
X dataset: CryptoDataDownload – Binance BTC/USDT Daily OHLCV
Y dataset: Cboe U.S. Equities Historical Market Volume Data 2020
Part of experiment: Bitcoin - CryptoDataDownload – Binance BTC/USDT Daily OHLCV vs Cboe U.S. Equities Historical Market Volume Data 2020