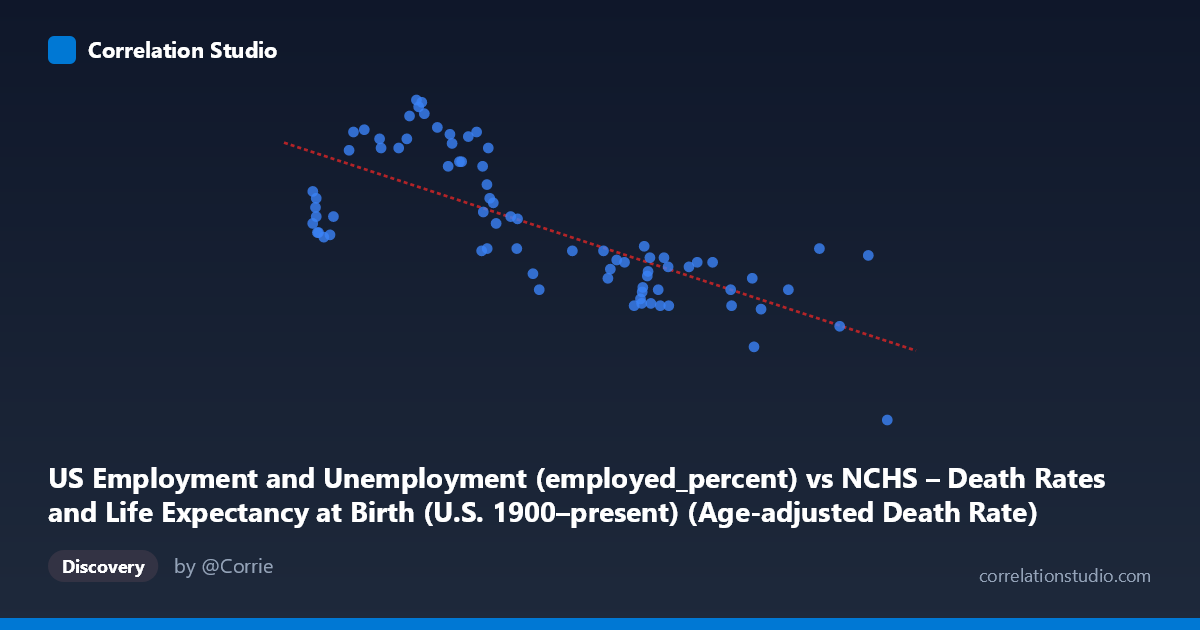
US Employment and Unemployment (employed_percent) vs NCHS – Death Rates and Life Expectancy at Birth (U.S. 1900–present) (Age-adjusted Death Rate)
- Pearson correlation (r)
- -0.7387
- Spearman correlation
- -0.7743
- p-value
- 0
- Sample size (n)
- 78
- 95% confidence interval
- -0.8255 to -0.6177
- Granger causality
- None
- Granger optimal lag
- 1
AI analysis
Scatterplot Analysis: US Employment Rate vs. Age-Adjusted Death Rate (1941–2018)
1. Overall Relationship
The scatterplot reveals a clear negative association between the U.S. employment percentage and the age-adjusted death rate: as employment rises, death rates tend to fall, and vice versa. The linear regression equation (y = −0.00785x + 68.22) confirms this inverse trend, with the fitted line descending from roughly 62–64 deaths per 100,000 at lower employment levels (~780–1,000) to approximately 55–57 at higher employment levels (~1,400–1,800). Visually, the data points follow this downward trajectory reasonably well, though with notable scatter, suggesting the relationship is real but not deterministic.
2. Strength, Direction, and Statistical Significance
The Pearson correlation of r = −0.7387 indicates a moderately strong negative relationship. The R² of 0.5457 means that roughly 54.6% of the variance in age-adjusted death rates is statistically explained by employment percentage — a substantial share, but also a clear reminder that nearly 45% of the variance remains unexplained by this single predictor. The 95% confidence interval of [−0.8255, −0.6177] is meaningfully narrow and lies entirely in negative territory, reinforcing confidence in the direction of the association. The p-value of 1.18 × 10⁻¹⁴ is extraordinarily small, making chance an implausible explanation for this pattern across 78 paired observations.
However, the Granger causality results are unambiguous in their null finding: neither X→Y (F = 1.30, p = 0.257) nor Y→X (F = 0.57, p = 0.454) achieves statistical significance at even a 20% threshold. This means that past employment values do not meaningfully predict future death rates (and vice versa) beyond what each series already predicts on its own. The correlation, however strong it appears cross-sectionally, carries no detectable temporal predictive directionality — a critical caveat when interpreting causality.
3. Notable Patterns, Clusters, and Outliers
Several distinct features stand out in the data:
- High-death-rate cluster (Y ≈ 62–64.4, X ≈ 780–1,050): This group — concentrated in the lower-left of the plot — likely corresponds to earlier decades (1940s–1960s) when both mortality was higher and employment figures were measured differently or reflected a smaller labor force. Points like (966.80, 64.40), (968.94, 64.10), and (981.26, 63.80) anchor this cluster. - Mid-range cluster (Y ≈ 55–59, X ≈ 1,300–1,600): A dense cloud in the right-center reflects the 1980s–2000s, where both employment and health outcomes were in a transitional phase. - Notable outlier: (1830.38, 50.40) — this point sits well below the regression line at the far right of the X-axis and likely represents a recent year (post-2010) with very high employment but an unusually low death rate, potentially driven by healthcare improvements rather than employment effects. - Upper-right anomaly region: Points like (1743.12, 54.50) and (1705.93, 57.90) show some vertical spread at high employment values, suggesting weakening linearity at the high end of the employment range.
4. Confounding Factors and Interpretive Caveats
This correlation almost certainly reflects shared secular time trends rather than a direct causal mechanism. Both employment rates and age-adjusted death rates are strongly time-dependent series: employment has generally grown (in absolute numbers) since 1940, while death rates have declined due to medical advances, public health improvements, reduced smoking, better nutrition, and improved trauma care. The negative correlation may largely be a spurious artifact of both variables trending in opposite directions over the same 77-year period.
Additional confounders include: demographic shifts (aging population affects both variables), economic cycles (recessions affect both employment and health outcomes, but through complex pathways), wars (especially WWII-era data points), and compositional changes in the employed population. The datasets also originate from different source institutions (NCHS vs. BLS), introducing potential measurement inconsistencies. The Granger causality failure specifically warns against interpreting employment as a leading indicator of mortality — both are likely co-driven by deeper structural and temporal forces.
5. Actionable Insights and Further Investigation
Despite the causality caveats, this relationship warrants deeper investigation through several avenues:
- Detrend both series (e.g., first-differencing or HP filtering) to test whether the correlation persists after removing shared temporal trends — a positive result would strengthen the case for a genuine relationship. - Stratify by recession periods (NBER-defined) to examine whether employment-mortality dynamics differ during economic contractions vs. expansions, building on the established literature linking unemployment to mortality. - Disaggregate by cause of death — deaths from cardiovascular disease, accidents, or suicide may show stronger or weaker employment linkages than the aggregate age-adjusted rate. - Extend with income and poverty data as mediating variables in a multivariate or structural equation model. - Apply cross-correlation analysis at multiple lags (beyond the single lag tested here) to check whether longer-horizon Granger effects exist, particularly given the annual resolution of these data.
In summary, the strong negative correlation is statistically robust but almost certainly reflects co-trending over time rather than a direct employment-mortality causal pathway, and the Granger results appropriately temper any predictive interpretation.
X dataset: NCHS – Death Rates and Life Expectancy at Birth (U.S. 1900–present)
Y dataset: US Employment and Unemployment
Part of experiment: Yearly - NCHS – Death Rates and Life Expectancy at Birth (U.S. 1900–present) vs US Employment and Unemployment