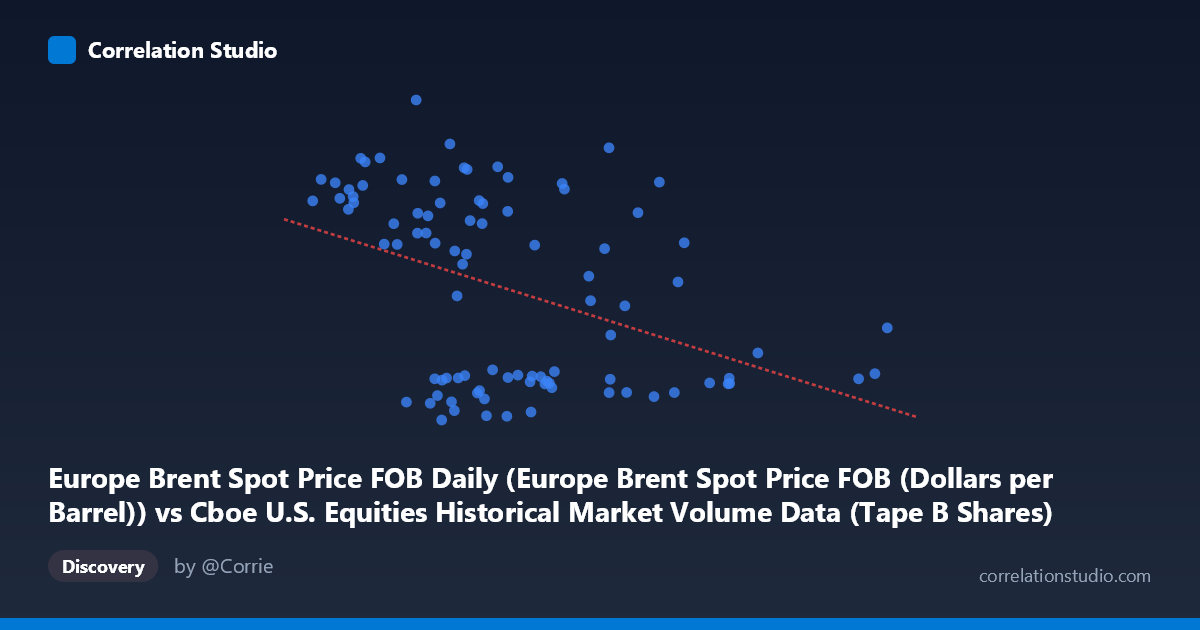
Europe Brent Spot Price FOB Daily (Europe Brent Spot Price FOB (Dollars per Barrel)) vs Cboe U.S. Equities Historical Market Volume Data (Tape B Shares)
- Pearson correlation (r)
- -0.4122
- Spearman correlation
- -0.3863
- p-value
- 0.000044
- Sample size (n)
- 92
- 95% confidence interval
- -0.569 to -0.2266
- Granger causality
- None
- Granger optimal lag
- 1
AI analysis
Analysis: Europe Brent Spot Price vs. Cboe Tape B Shares (2026)
Relationship Overview The scatterplot reveals a negative relationship between Europe Brent Spot Price FOB (X-axis) and Cboe U.S. Equities Tape B Share volume (Y-axis), meaning that as oil prices rise, Tape B equity trading volume tends to decline, and vice versa. The linear regression equation (y = -1.688E-07x + 130.398) captures this downward slope, though the scatter around the regression line is substantial. Visually, the data suggests two loosely separated behavioral zones: higher oil prices (roughly 260–393M range on X) cluster near lower Y values (~62–105), while lower oil prices concentrate a wider spread of Y values including many elevated readings (~100–138).
Correlation Strength and Statistical Significance The Pearson correlation of r = -0.41 indicates a moderate negative association, but the explanatory power is modest — R² = 0.17 means only 17% of the variance in Tape B share volume is explained by Brent oil prices, leaving 83% attributable to other factors. The 95% confidence interval of [-0.569, -0.227] is entirely negative, confirming directional consistency, and the p-value of 4.44E-05 establishes strong statistical significance well below the 0.001 threshold, ruling out a chance finding given the sample of 92 paired observations drawn from a population of 1,980. However, statistical significance here is partly a function of sample size and should not be conflated with practical importance. Critically, Granger causality tests find no significant predictive directionality in either direction (X→Y: F=0.311, p=0.578; Y→X: F=0.075, p=0.785), meaning neither variable reliably predicts future values of the other at a one-period lag — the correlation is contemporaneous and associative, not predictive or causal.
Notable Patterns, Clusters, and Outliers Several structural features stand out in the data. There is a notable high-density cluster at low Y values (~62–75) spanning a wide X range (~190M–395M), suggesting that low Tape B volume is a frequent condition regardless of oil price level — this horizontal band may represent baseline trading days. A second cluster of high Y values (100–138) concentrates predominantly at lower X values (<230M), implying elevated equity trading volume is more common when oil prices are lower. A few points warrant individual attention: (182,971,216; 138.21) is the highest Y outlier — a low oil price day with extraordinarily high Tape B volume; (393,280,831; 83.28) and (387,766,295; 72.25) sit at the extreme high end of X with moderate-to-low Y values, consistent with the negative trend. The spread of Y values at mid-range X values (~190–230M) is notably wide, suggesting the relationship weakens in that zone.
Confounding Factors and Interpretive Caveats This correlation should be interpreted with considerable caution. The dataset labeling appears inverted — Brent oil price data is listed as originating from a Cboe market volume dataset and vice versa, which raises data provenance questions and warrants verification before drawing conclusions. Substantively, both variables are driven by macroeconomic regime shifts: risk-off environments (geopolitical stress, recession fears) can simultaneously depress oil prices and elevate equity trading volume through volatility-driven activity, while risk-on environments may do the opposite — creating a spurious correlation mediated by investor sentiment. The short time window (Jan–May 2026) limits generalizability, and the relationship may reflect a specific macro episode rather than a structural dynamic. Additionally, Tape B specifically covers NYSE American and regional exchange stocks, a narrow slice of equity activity that may respond differently than broader market volume.
Actionable Insights and Further Investigation Given the moderate correlation without Granger causality, practitioners should avoid using oil prices as a leading indicator for Tape B volume forecasting at a one-day lag. Further investigation should test longer lag structures (5–20 trading days) and non-linear models (e.g., threshold regression separating high/low volatility regimes), which might reveal conditional relationships invisible in the linear framework. It would be valuable to control for the VIX or broader market volatility to test whether the oil-volume relationship disappears once investor fear is accounted for. Expanding the time series beyond five months and segmenting by market regime (bull/bear, high/low volatility) could clarify whether this association is structural or episodic. Finally, resolving the apparent data labeling discrepancy is an essential first step before any operational use of these findings.
X dataset: Cboe U.S. Equities Historical Market Volume Data
Y dataset: Europe Brent Spot Price FOB Daily
Part of experiment: Daily - Cboe U.S. Equities Historical Market Volume Data vs Europe Brent Spot Price FOB Daily