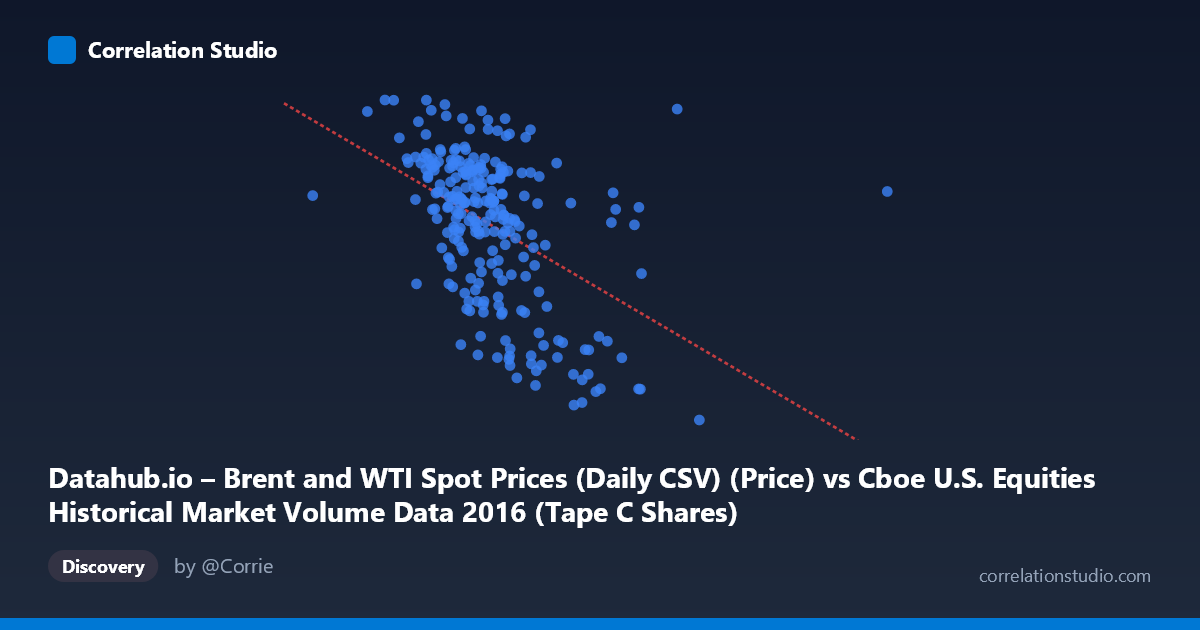
Datahub.io – Brent and WTI Spot Prices (Daily CSV) (Price) vs Cboe U.S. Equities Historical Market Volume Data 2016 (Tape C Shares)
- Pearson correlation (r)
- -0.4706
- Spearman correlation
- -0.4989
- p-value
- 0
- Sample size (n)
- 251
- 95% confidence interval
- -0.5617 to -0.3683
- Granger causality
- None
- Granger optimal lag
- 1
AI analysis
Analysis: Brent Crude Oil Prices vs. Cboe Tape C Share Volume (2016)
Relationship Overview The scatterplot reveals a moderate negative relationship between U.S. equity market volume (Tape C shares, on the X-axis) and Brent crude oil spot prices (Y-axis) across 251 trading days in 2016. As trading volume increases, oil prices tend to decline, and conversely, lower volume periods tend to coincide with higher oil prices. The linear regression equation (y = -1.158×10⁻⁷x + 59.07) captures this downward slope, though considerable scatter around the regression line is immediately apparent, suggesting the relationship is real but far from deterministic.
Correlation Strength and Statistical Significance The Pearson correlation of r = -0.4706 indicates a moderate negative association. However, the coefficient of determination (R² = 0.2215) is the more practically informative statistic: only about 22% of the variance in Brent crude prices is explained by Tape C share volume, leaving roughly 78% attributable to other factors. The 95% confidence interval for r spans [-0.5617, -0.3683], which is meaningfully wide and indicates non-trivial uncertainty in the precise strength of the relationship, though notably the entire interval excludes zero. The p-value of 3.1×10⁻¹⁵ confirms the correlation is highly statistically significant given the sample size of 251 — this is almost certainly not a chance association. Critically, however, Granger causality tests find no significant predictive direction in either direction (X→Y: F=1.41, p=0.237; Y→X: F=0.016, p=0.900). This means that despite the contemporaneous correlation, neither variable's past values meaningfully predict the other's future values at the tested lag, strongly cautioning against any causal interpretation.
Notable Patterns, Clusters, and Outliers Several features stand out visually. There is a dense central cluster concentrated roughly between 100–145 million shares and 40–52 USD/barrel, representing the modal trading conditions of 2016. Around this core, a distinct dispersion is visible at lower oil price levels (26–38 USD/barrel), which tend to occur across a broader range of volumes, including some notably high-volume days. The sample point at approximately (228,954,616; 26.01) is a clear outlier — an exceptionally high-volume day coinciding with very low oil prices — and likely corresponds to early 2016 when oil prices hit multi-year lows and market volatility was elevated. Similarly, several points around (163–175 million shares, 27–33 USD/barrel) form a loose low-price cluster that pulls the regression line. At the upper end of oil prices (49–55 USD/barrel), volume tends to be more tightly clustered in a moderate range, suggesting calmer, lower-volume trading conditions during price recovery periods.
Confounding Factors and Caveats This correlation almost certainly reflects a shared macro-economic backdrop rather than a direct mechanical link between equity trading volume and oil prices. The year 2016 was characterized by a distinctive narrative arc: oil prices began near 12-year lows in January–February (driving market volatility and elevated trading volumes), then gradually recovered through the year as OPEC negotiations progressed. Elevated equity market volatility (e.g., from China growth fears, Brexit in June, and the U.S. election in November) independently drives higher trading volume, and many of those same macro shocks also affected oil prices. Tape C specifically captures NYSE Arca-listed securities, which include a large number of ETFs — including commodity and oil-related ETFs — meaning some of the correlation may be partially mechanical through volume in oil-tracking instruments. The dataset label mismatch (axis labels appear swapped between the two datasets) should also be verified before drawing firm conclusions.
Actionable Insights and Further Investigation Given that the correlation is statistically significant but explains only ~22% of variance and lacks Granger-causal structure, several follow-up analyses are warranted. First, decomposing Tape C volume by security type (ETFs vs. equities, energy sector vs. broad market) would clarify whether the correlation is driven by oil-linked instruments specifically. Second, including the CBOE VIX (volatility index) as a control variable would likely absorb much of the shared variance, testing whether the oil-volume relationship survives after accounting for overall market fear. Third, examining the time series sequentially — rather than as a pooled cross-section — could reveal whether the correlation is concentrated in Q1 2016 (the low-oil-price, high-volatility period) and weak or absent in the rest of the year, which would indicate a regime-dependent rather than persistent relationship. Finally, extending the analysis to multiple years would determine whether 2016 represents an anomalous period or a structurally repeating pattern.
X dataset: Cboe U.S. Equities Historical Market Volume Data 2016
Y dataset: Datahub.io – Brent and WTI Spot Prices (Daily CSV)
Part of experiment: Daily - Cboe U.S. Equities Historical Market Volume Data 2016 vs Datahub.io – Brent and WTI Spot Prices (Daily CSV)