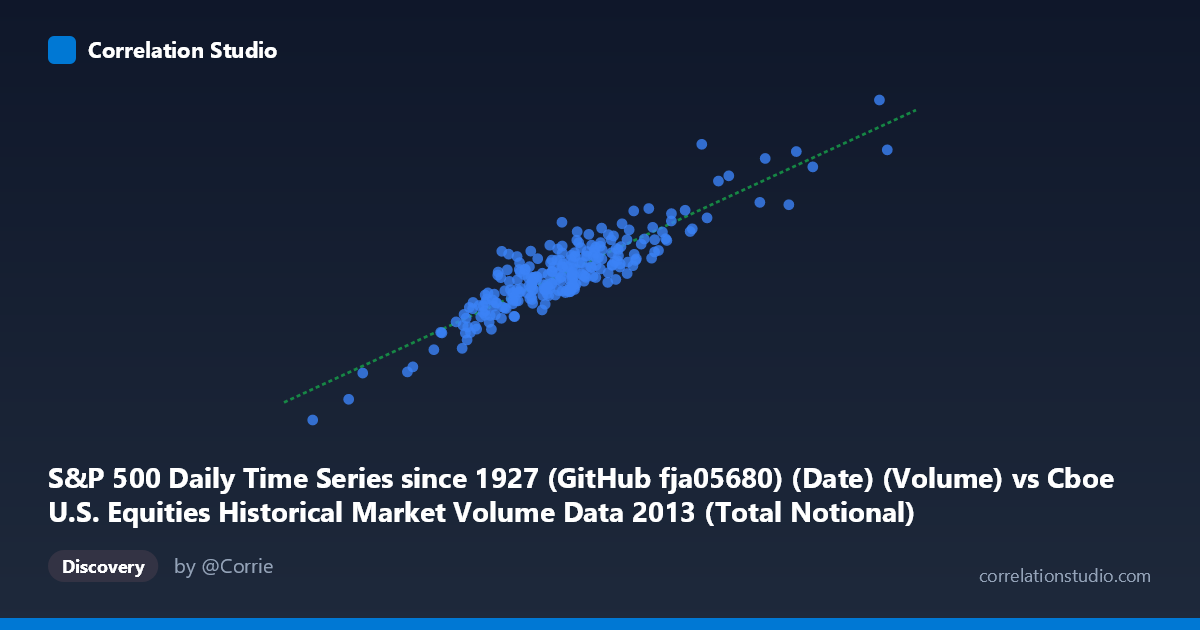
S&P 500 Daily Time Series since 1927 (GitHub fja05680) (Date) (Volume) vs Cboe U.S. Equities Historical Market Volume Data 2013 (Total Notional)
- Pearson correlation (r)
- 0.9013
- Spearman correlation
- 0.8379
- p-value
- 0
- Sample size (n)
- 252
- 95% confidence interval
- 0.8753 to 0.9222
- Granger causality
- None
- Granger optimal lag
- 10
AI analysis
Analysis: S&P 500 Trading Volume vs. Cboe Total Notional Value (2013)
Relationship Overview The scatterplot reveals a strong positive linear relationship between S&P 500 daily trading volume and Cboe U.S. Equities total notional value across the 2013 trading year. As daily share volume increases, total notional value traded rises correspondingly, which is intuitively logical — more shares changing hands at prevailing price levels naturally inflates the aggregate dollar value of transactions. The linear regression equation (y = 0.1946x + 4.70×10⁸) suggests that for every additional share of volume, approximately $0.19 in notional value is generated, with a baseline intercept reflecting fixed structural notional activity independent of volume fluctuations.
Correlation Strength and Statistical Significance The correlation is notably strong (r = 0.9013), and the R² of 0.8124 indicates that roughly 81.2% of the variance in total notional value is explained by trading volume — a substantial proportion for financial market data. The 95% confidence interval [0.8753, 0.9222] is narrow and well above zero, confirming the estimate is precise and reliable. The p-value of effectively zero, combined with a sample of 252 paired daily observations, leaves no ambiguity about statistical significance. However, the Granger causality results complicate the narrative: neither direction (X→Y nor Y→X) achieves significance at the optimal 10-period lag (F = 1.376, p = 0.193; F = 0.828, p = 0.602), meaning that despite the strong contemporaneous correlation, neither variable reliably predicts the other temporally. This is a critical distinction — the two variables move together on the same day but do not lead or lag each other in a causally meaningful way.
Notable Patterns, Clusters, and Outliers The data cloud is moderately tight around the regression line across the mid-range of volume (roughly 12–18 billion shares), where the bulk of trading days cluster. However, several notable outliers are visible at the lower-left extreme — particularly points near volumes of ~8.2 billion and ~9.9 billion shares with correspondingly depressed notional values (~1.97B and ~2.05B respectively), likely reflecting holiday-shortened sessions or abnormally quiet market days. At the upper end, a cluster around 19–20 billion shares with notional values approaching 4.7–5.8 billion suggests elevated volatility episodes or index rebalancing events. One point near (14.8B volume, 4.1B notional) appears to deviate upward from the regression trend, potentially reflecting a day with unusually high-priced stock activity inflating notional value disproportionately to share count.
Confounding Factors and Caveats Several important caveats apply. First, notional value is inherently a function of both volume and price levels, meaning that any days with unusual constituent stock prices (e.g., high-priced stocks like GOOG or AMZN dominating activity) would inflate notional value independent of total share count. Second, the datasets originate from different sources (GitHub S&P 500 time series vs. Cboe market data), introducing potential definitional mismatches — "volume" in the S&P 500 series may capture index-constituent trades specifically, while Cboe's notional captures broader U.S. equities including ETFs and non-S&P names. Third, the absence of Granger causality at 10 lags suggests the relationship is largely contemporaneous and structurally driven rather than dynamic, possibly reflecting that both variables are jointly driven by a third factor — overall market activity levels or investor sentiment — rather than one driving the other.
Actionable Insights and Further Investigation Practitioners should avoid using lagged volume as a predictor of future notional value (or vice versa) given the failed Granger tests, but the contemporaneous relationship could be exploited for real-time notional estimation from volume data. The ~19% unexplained variance deserves investigation: incorporating average trade size, VIX levels, or intraday price range as additional regressors could improve the model substantially. It would also be valuable to segment outlier days (suspected holidays, expiration Fridays, FOMC announcement days) and model them separately to assess whether the linear relationship holds uniformly or breaks down under specific market regimes. Finally, extending this analysis across multiple years would test whether the r = 0.90 relationship is stable or whether structural changes in market microstructure (algorithmic trading growth, exchange fee changes) alter the volume-notional dynamic over time.
X dataset: Cboe U.S. Equities Historical Market Volume Data 2013
Y dataset: S&P 500 Daily Time Series since 1927 (GitHub fja05680) (Date)
Part of experiment: Daily - Cboe U.S. Equities Historical Market Volume Data 2013 vs S&P 500 Daily Time Series since 1927 (GitHub fja05680) (Date)