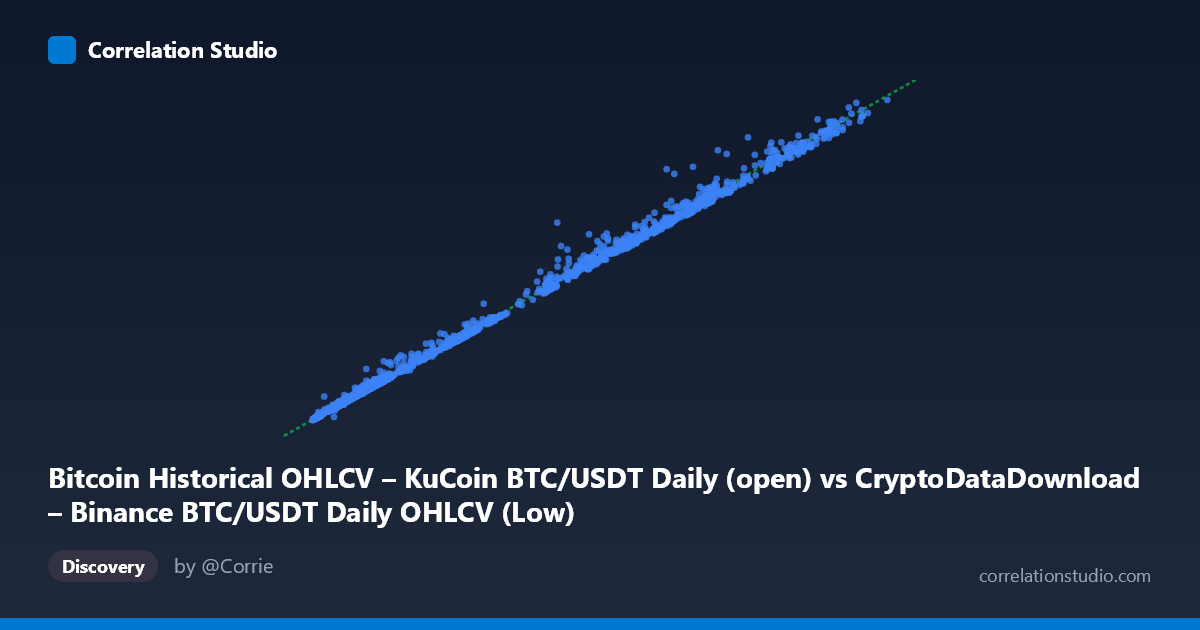
Bitcoin Historical OHLCV – KuCoin BTC/USDT Daily (open) vs CryptoDataDownload – Binance BTC/USDT Daily OHLCV (Low)
- Pearson correlation (r)
- 0.9985
- Spearman correlation
- 0.9981
- p-value
- 0
- Sample size (n)
- 1861
- 95% confidence interval
- 0.9984 to 0.9986
- Granger causality
- None
- Granger optimal lag
- 10
AI analysis
Analysis: BTC/USDT Open (Binance) vs. Low (KuCoin)
1. Relationship Overview The scatterplot shows an extremely tight, near-perfect linear relationship between Binance's daily BTC/USDT open price and KuCoin's daily BTC/USDT low price. Points hug a straight line across nearly the entire price range (~$3,150 to ~$66,200), spanning roughly five years of trading history. This is expected behavior for the same underlying asset traded across two liquid, arbitrage-linked exchanges — price discovery should track closely between them.
2. Strength, Direction, and Statistical Confidence The correlation is essentially maximal (r = 0.9985, r² = 0.997), meaning 99.7% of the variance in KuCoin's low price is statistically explained by Binance's open price. The narrow 95% CI [0.9984, 0.9986] confirms this estimate is highly stable and not an artifact of sampling noise, and the p-value of 0 (effectively <10⁻³⁰⁰) rules out chance as an explanation. The regression slope (1.032) and small positive intercept (28.74) indicate KuCoin's low is very slightly higher than Binance's open on average — consistent with "open" and "low" being different intraday reference points rather than identical quotes.
Importantly, the Granger causality test shows no significant predictive direction in either direction (X→Y: p=0.136; Y→X: p=0.144) at the optimal 10-day lag. This is a critical nuance: despite the near-unity contemporaneous correlation, neither series' past values help forecast the other's future values beyond what's already reflected in same-day pricing. This is the classic case of high correlation without lead-lag predictability — the two series move together virtually simultaneously (same asset, same global market), not one driving the other over time.
3. Patterns, Clusters, and Non-Linear Features Data points cluster more densely at lower price levels ($3,000–$20,000), reflecting BTC's price history where prolonged periods (2018–2020, 2022 bear market) traded in that range, with sparser coverage in the $40,000–$66,000 zone corresponding to the 2021 bull run and 2022 peak. No visible curvature, heteroskedasticity, or fanning is apparent — residual dispersion appears proportional to price level (consistent with percentage-based volatility rather than fixed-dollar noise), which is typical for financial return data. No clear outlier clusters or structural breaks are evident from the sample, though the mid-$40,000s region (see repeated values like 40911, 40888, 40501, 42137) suggests a period of price consolidation.
4. Confounding Factors and Caveats This correlation is not measuring a causal economic relationship — it reflects the fact that both series describe the same asset (BTC/USDT) on two exchanges linked by arbitrage, shared order flow, and common market sentiment. Key caveats: - Same-day contamination: "Open" and "Low" are derived from overlapping daily windows, so some mechanical correlation is guaranteed by construction, not just market efficiency. - Non-independence of observations: Daily price data is highly autocorrelated (trending), inflating apparent correlation strength relative to a random-walk-adjusted measure (e.g., correlation of returns would be more meaningful than correlation of price levels). - Aggregation across regimes: Pooling bull and bear markets into one linear fit can mask regime-specific relationship changes (e.g., during flash crashes or exchange-specific liquidity gaps, spreads between exchanges can widen briefly).
5. Suggested Further Investigation - Re-run correlation/Granger tests on log-returns rather than price levels to remove trend-driven correlation and test true short-term lead-lag microstructure (e.g., does one exchange lead price discovery during volatile events?). - Examine spread (KuCoin Low − Binance Open) over time to detect periods of arbitrage dislocation, exchange-specific liquidity stress, or regulatory/outage events (useful for arbitrage or risk-monitoring strategies). - Segment analysis by volatility regime (bull/bear/sideways) to check if the near-1:1 relationship holds uniformly or degrades during extreme moves. - Given the lack of Granger causality, this pair is better used for cross-exchange consistency checks or arbitrage monitoring rather than forecasting one exchange from the other.
X dataset: CryptoDataDownload – Binance BTC/USDT Daily OHLCV
Y dataset: Bitcoin Historical OHLCV – KuCoin BTC/USDT Daily
Part of experiment: Bitcoin - CryptoDataDownload – Binance BTC/USDT Daily OHLCV vs Bitcoin Historical OHLCV – KuCoin BTC/USDT Daily