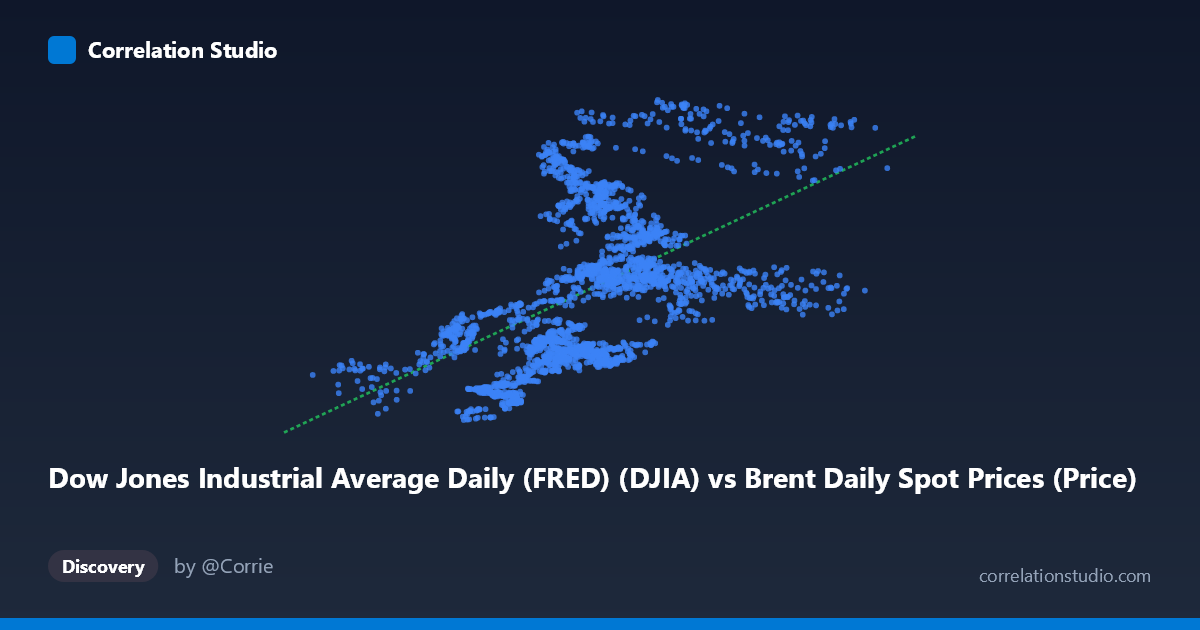
Dow Jones Industrial Average Daily (FRED) (DJIA) vs Brent Daily Spot Prices (Price)
- Pearson correlation (r)
- 0.528
- Spearman correlation
- 0.5849
- p-value
- 0
- Sample size (n)
- 2474
- 95% confidence interval
- 0.499 to 0.5559
- Granger causality
- None
- Granger optimal lag
- 10
- Time coverage
- 2016-10-24 to 2026-10-20
- Recomputed on refreshed data
- 2026-10-22 (r was 0.5277)
AI analysis
Analysis: Brent Crude Oil Prices vs. Dow Jones Industrial Average (2016–2026)
Relationship Overview The scatterplot reveals a moderate positive relationship between daily Brent crude oil spot prices (X-axis) and the Dow Jones Industrial Average (Y-axis), described by the regression equation y = 226.43x + 15,715.6. As oil prices rise, the DJIA tends to increase as well — a somewhat counterintuitive finding, since conventional wisdom often frames higher energy costs as a headwind for equity markets. However, this pattern likely reflects a shared underlying driver: periods of robust global economic activity tend to simultaneously lift both energy demand (pushing oil prices up) and corporate earnings (pushing equity indices higher). The relationship is real but far from deterministic, as the wide dispersion of points around the regression line makes immediately clear.
Correlation Strength and Statistical Significance With r = 0.5183 and r² = 0.2686, only about 26.9% of the variance in DJIA values is explained by Brent crude prices. While the correlation is statistically unambiguous — the p-value is effectively zero across n = 2,471 paired observations, and the 95% confidence interval [0.4888, 0.5465] is tight and well above zero — the practical explanatory power is modest at best. Roughly 73% of DJIA variation is driven by factors entirely unrelated to oil prices, including monetary policy, earnings cycles, geopolitical shocks, and investor sentiment. Critically, the Granger causality tests reveal no significant predictive directionality in either direction: X→Y yields F = 1.48 (p = 0.14) and Y→X yields F = 0.92 (p = 0.52), both non-significant even at an optimal lag of 10 periods. This means that knowing today's oil price does not meaningfully help forecast tomorrow's DJIA, and vice versa — the correlation is concurrent rather than temporally predictive.
Patterns, Clusters, and Outliers Several structural features stand out in the sample points. There is a notable lower-left cluster (oil prices roughly $15–$55/barrel, DJIA roughly $17,000–$22,000) that likely corresponds to the 2016–2017 period when oil was depressed and markets, while rising, were at lower absolute levels. A dense central cloud dominates the $55–$90 oil range and $25,000–$42,000 DJIA range, reflecting the bulk of the 2018–2024 trading environment. Several high-leverage outliers are apparent: the point near (111.86, 49,230) and (101.66, 34,566) suggest that very high oil prices do not reliably correspond to very high DJIA values — the relationship weakens at extremes. The point at (15.60, 24,101) almost certainly reflects the April 2020 oil price collapse, when pandemic-driven demand destruction briefly sent crude prices to historic lows while the DJIA had already partially rebounded, representing a structural regime break rather than a typical observation.
Confounding Factors and Caveats This correlation is almost certainly spurious in the classical sense — both series are heavily influenced by a common third variable: global macroeconomic conditions. Expansionary periods drive both oil demand and equity valuations; recessions suppress both. Additionally, both series exhibit strong temporal autocorrelation and trending behavior, which can artificially inflate measured correlations between non-stationary time series (a classic "spurious regression" problem in econometrics). The 10-year time window (2016–2026) also captures multiple distinct regimes: post-2016 oil recovery, the 2018 trade war volatility, the 2020 COVID crash and recovery, the 2021–2022 inflation/energy shock, and the subsequent rate-hiking cycle — each with different oil-equity dynamics. The axis labels also appear swapped in the dataset metadata (Brent prices are on X, DJIA on Y, but dataset names are reversed), warranting verification of data provenance before drawing firm conclusions.
Actionable Insights and Further Investigation Practitioners should treat this correlation as background context rather than a tradeable signal, given the absence of Granger causality. Several avenues merit deeper exploration: (1) Regime-conditional analysis — segmenting the data by macroeconomic phase (expansion, recession, stagflation) would likely reveal dramatically different correlation structures within each regime; (2) Sector decomposition — energy sector stocks within the DJIA likely drive much of this correlation, and stripping them out may reveal a negative relationship for the remainder; (3) Non-linear modeling — the visible heteroscedasticity and outliers suggest that a piecewise or polynomial fit may outperform the linear model; (4) Stationarity correction — running the correlation on log-differenced (return) series rather than levels would better isolate the contemporaneous relationship and eliminate spurious trend-driven inflation; and (5) Multivariate modeling incorporating USD strength, interest rates, and VIX would likely absorb much of the unexplained 73% variance and clarify whether oil retains any independent explanatory power for equity performance.
X dataset: Brent Daily Spot Prices
Y dataset: Dow Jones Industrial Average Daily (FRED)
Part of experiment: Daily - Brent Daily Spot Prices vs Dow Jones Industrial Average Daily (FRED)