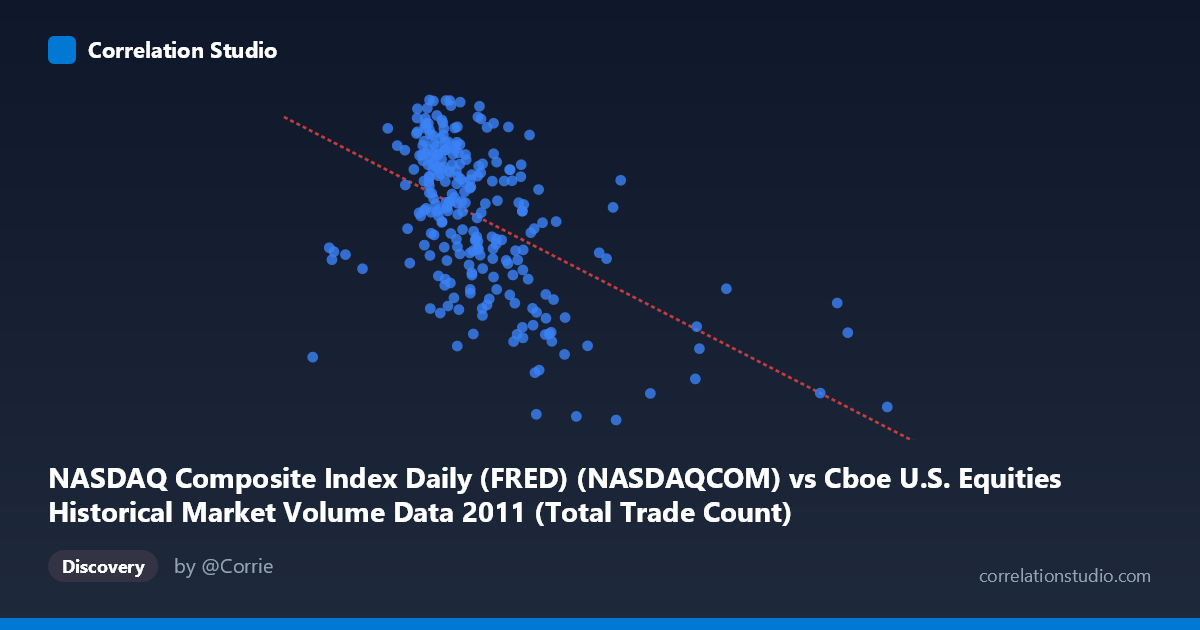
NASDAQ Composite Index Daily (FRED) (NASDAQCOM) vs Cboe U.S. Equities Historical Market Volume Data 2011 (Total Trade Count)
- Pearson correlation (r)
- -0.5224
- Spearman correlation
- -0.5089
- p-value
- 0
- Sample size (n)
- 252
- 95% confidence interval
- -0.6068 to -0.4263
- Granger causality
- X → Y
- Granger optimal lag
- 10
AI analysis
Analysis: NASDAQ Composite Index vs. U.S. Equities Total Trade Count (2011)
Relationship Overview
The scatterplot reveals a moderate negative relationship between the NASDAQ Composite Index daily closing value (X) and the total trade count across U.S. equities exchanges (Y). As the NASDAQ index rises, total trade count tends to decline — a counterintuitive finding at first glance, but one that reflects a well-documented market microstructure phenomenon: during bullish, rising-price environments, trading volume and transaction counts often consolidate, while market stress and volatility (typically associated with lower index values) tend to fragment order flow and drive up trade counts. The linear regression equation (y = -0.000120x + 2,920.42) captures this downward slope, though the relationship is far from deterministic.
Correlation Strength and Statistical Significance
With r = -0.5224, the correlation is moderate and negative, but the explanatory power is meaningfully limited: R² = 0.2729, meaning only about 27.3% of the variance in total trade count is explained by the NASDAQ index level. The remaining ~73% is attributable to other factors entirely. The 95% confidence interval of [-0.6068, -0.4263] is reasonably tight and does not cross zero, and the p-value is effectively 0 across a sample of n = 252 paired observations drawn from a population of N = 3,780 — confirming this is not a chance finding. The Granger causality results add a critical temporal dimension: X Granger-causes Y unidirectionally at an optimal lag of 10 trading periods (F = 1.94, p = 0.041), while Y does not Granger-cause X (F = 0.34, p = 0.970). This suggests that NASDAQ index movements carry predictive information about future trade counts approximately two calendar weeks out, but trade counts carry no reciprocal predictive power for the index — a meaningful asymmetry for trading infrastructure and market surveillance applications.
Notable Patterns, Clusters, and Outliers
Several structural features are visible in the sample data. There is a dense central cluster roughly between NASDAQ values of 1,600,000–2,200,000 and trade counts of 2,600–2,850, representing the bulk of 2011 trading days. However, there are notable right-tail outliers at very high X values (e.g., ~3,600,000 and ~4,978,000) paired with relatively lower trade counts (~2,490–2,740), consistent with the negative trend. Conversely, some observations at lower X values show elevated trade counts approaching 2,870 — near the Y-axis maximum. The relationship also shows increased scatter at lower index values, hinting at possible heteroskedasticity: trade count variability appears wider when the market is lower, which may reflect the volatile, stress-driven conditions of mid-2011 (the U.S. debt ceiling crisis and European sovereign debt contagion). There is also a suggestion of a non-linear curve — the decline in trade count may steepen at higher index values — worth exploring with polynomial or log-linear models.
Confounding Factors and Interpretive Caveats
Several important caveats apply. First, 2011 was an anomalous year marked by extreme volatility events (August 2011 market selloff, S&P U.S. credit downgrade), meaning the correlation may be period-specific rather than structural. Second, secular trends in both series — the NASDAQ recovering from early-year lows while algorithmic trading volumes evolved throughout the year — could create spurious temporal correlation that Granger causality partially (but not fully) controls for. Third, the 10-period Granger lag, while statistically significant, produces a modest F-statistic (1.94 against a threshold near 2.0), suggesting the predictive relationship is real but weak. Fourth, total trade count aggregates across all U.S. exchanges and TRFs, so NASDAQ-specific dynamics may be diluted. Finally, omitted variables such as VIX (volatility index), bid-ask spreads, or algorithmic trading activity rates are likely driving both series simultaneously.
Actionable Insights and Further Investigation
Practitioners in market microstructure, exchange operations, or trading cost analysis should consider this 10-day predictive lag as a potential leading signal for capacity planning or surveillance resource allocation — rising NASDAQ levels today may predict lower trade volumes roughly two weeks ahead. For further investigation, it would be valuable to: (1) include VIX as a covariate to isolate volatility's confounding role; (2) test the relationship across multiple years to assess whether 2011's anomalous conditions drive the correlation; (3) apply rolling-window correlation analysis to detect whether the relationship strengthens or breaks down across different market regimes; and (4) explore non-linear models (polynomial regression or GAMs) given the visual suggestion of a curved relationship. Decomposing trade count by exchange or trade type (lit vs. dark) could also reveal whether the effect is concentrated in specific market segments.
X dataset: Cboe U.S. Equities Historical Market Volume Data 2011
Y dataset: NASDAQ Composite Index Daily (FRED)
Part of experiment: Daily - Cboe U.S. Equities Historical Market Volume Data 2011 vs NASDAQ Composite Index Daily (FRED)