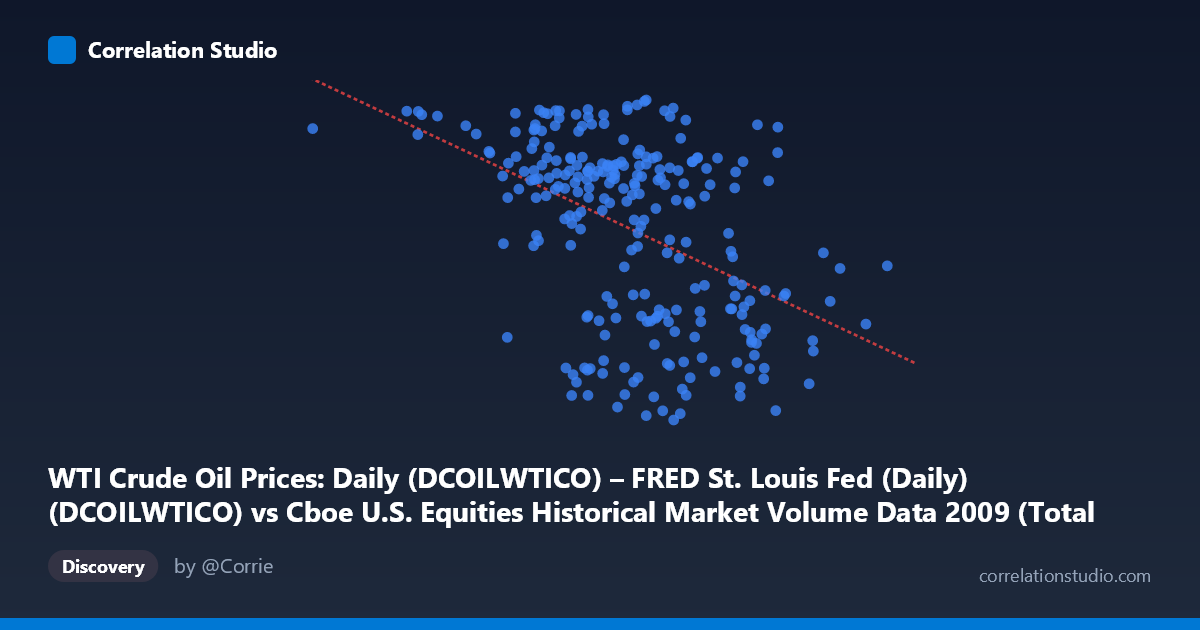
WTI Crude Oil Prices: Daily (DCOILWTICO) – FRED St. Louis Fed (Daily) (DCOILWTICO) vs Cboe U.S. Equities Historical Market Volume Data 2009 (Total Shares)
- Pearson correlation (r)
- -0.4531
- Spearman correlation
- -0.4389
- p-value
- 0
- Sample size (n)
- 252
- 95% confidence interval
- -0.5461 to -0.3491
- Granger causality
- None
- Granger optimal lag
- 1
AI analysis
Analysis: WTI Crude Oil Prices vs. U.S. Equities Total Shares Traded (2009)
Relationship Overview
The scatterplot reveals a moderate negative relationship between WTI crude oil prices (X-axis) and total U.S. equity shares traded (Y-axis) across 2009. As oil prices rise, equity trading volume tends to decline, and vice versa. This inverse pattern is visible across the data cloud, though with considerable scatter. The linear regression equation (y = -3.90×10⁻⁸x + 91.60) confirms the downward slope, meaning that for every $1/barrel increase in oil prices (roughly 100 million units on the x-axis scale), total shares traded decreases by approximately 3.9 units. Given that 2009 spanned the tail end of the financial crisis and a dramatic oil price recovery from ~$30 to ~$80/barrel, this relationship likely reflects broader macroeconomic dynamics rather than a direct causal mechanism.
Correlation Strength and Statistical Significance
The correlation of r = -0.4531 indicates a moderate negative association, but the explained variance tells a more sobering story: r² = 0.2053 means only ~20.5% of the variance in equity trading volume is explained by oil prices, leaving nearly 80% attributable to other factors. The 95% confidence interval of [-0.5461, -0.3491] is entirely negative and reasonably tight, suggesting genuine directional certainty even if the magnitude is imprecise. The p-value of 3.664×10⁻¹⁴ is highly significant, confirming this is not a chance finding across the n=252 paired observations drawn from an N=3,232 population. However, Granger causality tests reveal no significant temporal predictive direction in either direction — neither X→Y (F=0.61, p=0.43) nor Y→X (F=0.12, p=0.73) — meaning that past oil prices do not meaningfully predict future trading volume, and vice versa, at the tested lag. The correlation is therefore contemporaneous and associative, not predictive or causal in a temporal sense.
Notable Patterns, Clusters, and Outliers
Several structural features are worth noting in the point cloud. There appear to be two loose clusters: one in the lower X range (~$200M–$650M, roughly corresponding to lower oil prices early in 2009 and in the recovery phase) with higher share volumes (65–81), and another in the higher X range (~$850M–$1.2B, corresponding to higher oil prices mid-to-late 2009) with lower volumes (37–58). A handful of notable outliers are visible: the point at approximately (192M, 76.83) sits far to the left, likely representing an early 2009 low-oil-price, high-volatility trading day. Conversely, points near (1,213M, 56.67) and (1,081M, 44.15) represent high-oil-price, low-volume extremes. The spread is notably wider at moderate X values, suggesting heteroscedasticity — variance in trading volume is not constant across oil price levels, which slightly undermines the linear model assumptions.
Confounding Factors and Interpretive Caveats
The 2009 context is critically important and likely drives much of this correlation spuriously through time. Both variables are heavily time-indexed: oil prices trended sharply upward through 2009 as the economy began recovering, while equity trading volumes — which were extraordinarily elevated during the 2008–2009 crisis panic — naturally declined as volatility subsided. This means both variables are responding to a common third factor (the financial crisis recovery arc) rather than to each other directly. Additionally, the datasets appear to have their axis labels swapped in the metadata description (the X-axis label references FRED oil price data while the Y-axis label references Cboe volume data, but the descriptions are transposed), which warrants verification. Seasonality, Federal Reserve policy actions (quantitative easing began in earnest in 2009), and broader risk-on/risk-off sentiment shifts are all plausible confounders that could explain the observed inverse pattern without any direct oil-volume mechanism.
Actionable Insights and Further Investigation
Given that the Granger causality results rule out temporal predictive utility, practitioners should not use oil prices as a leading indicator for equity trading volumes at a one-day lag. However, the contemporaneous correlation is real enough to warrant further exploration. Recommended next steps include: (1) controlling for time/date as a covariate to isolate whether the relationship holds after removing the shared 2009 recovery trend; (2) extending the analysis across multiple years (2007–2012) to test whether the negative correlation is specific to crisis-recovery periods or persists in stable markets; (3) testing longer Granger lags (5, 10, 21 trading days) since market participants may respond to sustained oil price moves rather than daily changes; and (4) disaggregating total shares traded by sector (especially energy stocks) to determine whether the relationship is concentrated in oil-sensitive equities or truly market-wide. The ~20.5% explained variance suggests oil prices are one modest piece of a much larger volume-prediction puzzle.
X dataset: Cboe U.S. Equities Historical Market Volume Data 2009
Y dataset: WTI Crude Oil Prices: Daily (DCOILWTICO) – FRED St. Louis Fed (Daily)
Part of experiment: Daily - Cboe U.S. Equities Historical Market Volume Data 2009 vs WTI Crude Oil Prices: Daily (DCOILWTICO) – FRED St. Louis Fed (Daily)