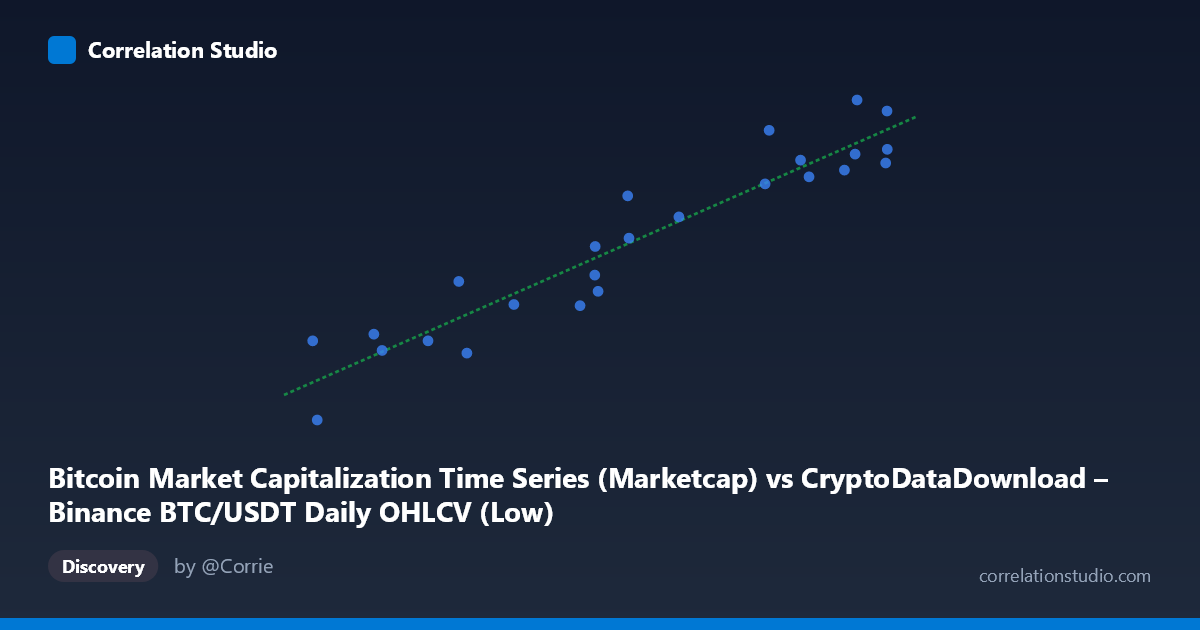
Bitcoin Market Capitalization Time Series (Marketcap) vs CryptoDataDownload – Binance BTC/USDT Daily OHLCV (Low)
- Pearson correlation (r)
- 0.9478
- Spearman correlation
- 0.9369
- p-value
- 0
- Sample size (n)
- 25
- 95% confidence interval
- 0.8835 to 0.977
- Granger causality
- None
- Granger optimal lag
- 6
AI analysis
Analysis: Bitcoin Market Cap vs. BTC/USDT Daily Low
1. Relationship Overview
This scatterplot compares Bitcoin's market capitalization against the daily low price of BTC/USDT on Binance over a roughly one-month window (March 29 – April 22, 2024). Since market cap is mathematically derived from price multiplied by circulating supply, and circulating supply changes negligibly over 25 days, these two variables are expected to be near-perfect linear transformations of one another. The scatterplot confirms this: points trace a tight, upward-sloping band with no visible curvature, consistent with a near-identity relationship modulated only by the small, steady growth in circulating supply.
2. Strength, Direction, and Statistical Confidence
The correlation is very strong and positive (r = 0.948), with r² = 0.898 indicating that 89.8% of the variance in the daily low price is explained by market cap alone. The 95% confidence interval [0.884, 0.977] is narrow and entirely excludes zero or weak-correlation values, and the p-value (6.67×10⁻¹³) is extraordinarily small — far below any conventional significance threshold. This gives high statistical confidence that the observed relationship is not due to chance.
However, the Granger causality results are notable: neither direction shows significant predictive power (X→Y: p=0.243; Y→X: p=0.340) at the tested lag of 6 periods. This is expected given the mechanical/contemporaneous nature of the relationship — market cap and price move together simultaneously rather than one leading the other in time. The lack of Granger causality should not be read as evidence against the relationship; rather, it confirms this is a contemporaneous identity-like relationship, not a lagged predictive one.
3. Patterns, Clusters, and Outliers
The data shows a generally consistent linear trend, but with some dispersion around the regression line — evident in points like (65064.52, 1,348,374,632,475) sitting above the trend while (64550.00, 1,287,882,435,488) sits below it at a similar X value. This scatter likely stems from the low price (Y) reflecting intraday minimums, while market cap (X) may be calculated from a different reference price (e.g., close or a volume-weighted average), introducing noise unrelated to a true structural break. No strong outliers or nonlinear regimes (e.g., regime shifts, clustering by date) are visually apparent; the relationship appears homogeneous across the sampled range.
4. Confounding Factors and Caveats
The central caveat is that this is not an independent correlation between two distinct phenomena — market cap is definitionally price × supply. With supply nearly constant over 25 days, the "correlation" mostly reflects the fact that both variables encode the same underlying price signal from overlapping but non-identical sources (market cap likely uses closing price; Y uses daily low). The residual ~10% unexplained variance likely comes from this open/high/low/close discrepancy rather than any independent economic relationship. Additionally, with only 25 daily observations, the sample is small and covers a single, single-regime month — results shouldn't be assumed to generalize to other market conditions (e.g., high-volatility crash periods where intraday range widens).
5. Suggestions for Further Investigation
Given the tautological nature of this relationship, more insight would come from comparing market cap growth (or price) against genuinely independent variables — e.g., trading volume, exchange inflows/outflows, or macro indicators (DXY, rates) — where causality tests would be meaningful. If the goal is to model price behavior, consider using intraday range (high−low) or volatility as the dependent variable instead, and extend the time window beyond one month to capture multiple market regimes for more robust Granger causality testing (the current lack of significance may partly reflect low power from n=25).
X dataset: CryptoDataDownload – Binance BTC/USDT Daily OHLCV
Y dataset: Bitcoin Market Capitalization Time Series
Part of experiment: Bitcoin - CryptoDataDownload – Binance BTC/USDT Daily OHLCV vs Bitcoin Market Capitalization Time Series