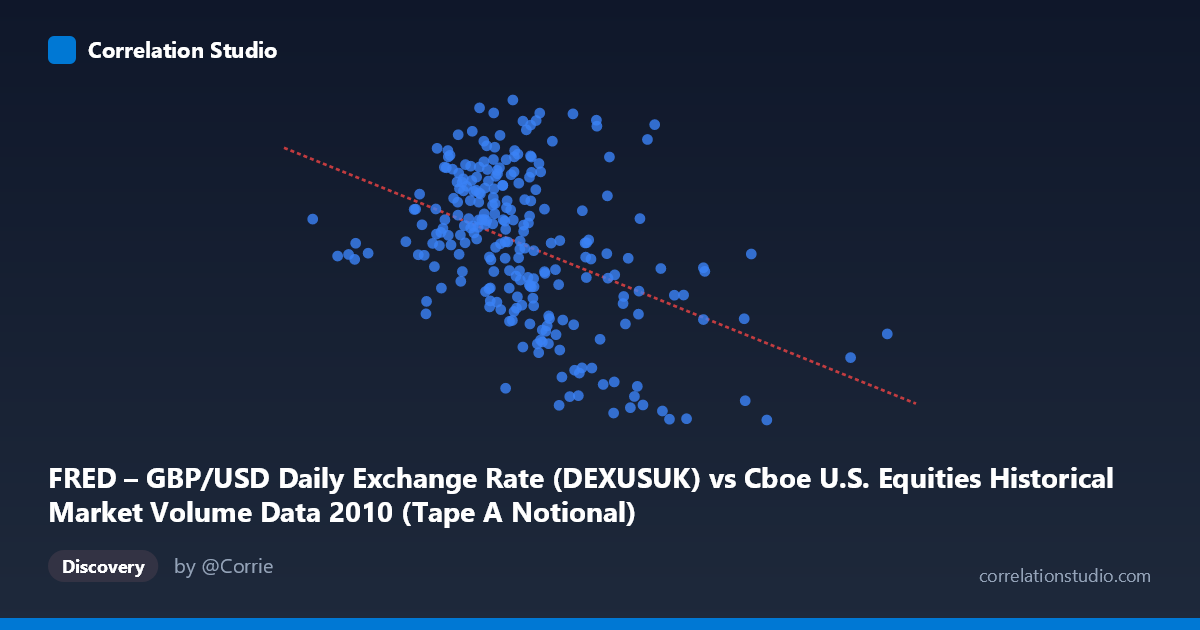
FRED – GBP/USD Daily Exchange Rate (DEXUSUK) vs Cboe U.S. Equities Historical Market Volume Data 2010 (Tape A Notional)
- Pearson correlation (r)
- -0.4328
- Spearman correlation
- -0.4221
- p-value
- 0
- Sample size (n)
- 249
- 95% confidence interval
- -0.5286 to -0.326
- Granger causality
- None
- Granger optimal lag
- 1
AI analysis
Scatterplot Analysis: GBP/USD Exchange Rate vs. Cboe U.S. Equities Market Volume (2010)
Relationship Overview
The scatterplot reveals a moderate negative relationship between U.S. equities market trading volume (X-axis) and the GBP/USD exchange rate (Y-axis) across 249 trading days in 2010. As market volume increases, the pound tends to weaken slightly against the dollar, following the linear regression equation y = -8.508×10⁻¹²x + 1.623. While the downward trend is statistically discernible, the scatter around the regression line is considerable, suggesting that volume alone is far from a complete explanation of daily currency movements. The bulk of observations cluster in the 6–12 billion share range with GBP/USD values between 1.48 and 1.63, forming a relatively dense central cloud with a subtle but visible negative slope.
Correlation Strength and Statistical Significance
The Pearson correlation of r = -0.43 indicates a moderate negative association, but the r² of 0.187 is the critical framing statistic here — equity market volume explains only 18.7% of the variance in GBP/USD, leaving over 81% attributable to other factors entirely. The 95% confidence interval of [-0.53, -0.33] is meaningfully away from zero and does not cross it, reinforcing that the negative direction is reliable. The p-value of 8.68×10⁻¹³ confirms this is highly unlikely to be a chance finding given n = 249. However, the Granger causality results temper any causal interpretation significantly: neither direction achieves significance at conventional thresholds (X→Y: F = 0.33, p = 0.56; Y→X: F = 3.48, p = 0.063). This means that past values of trading volume do not reliably predict future GBP/USD movements, and vice versa — the correlation is contemporaneous rather than predictively directional.
Notable Patterns, Clusters, and Outliers
Several features stand out beyond the central cluster. There are a handful of high-volume outliers exceeding 13–16 billion (e.g., points near 14.0B, 15.98B, and 20.1B on the X-axis) that tend to appear at lower GBP/USD values (around 1.44–1.54), which disproportionately anchor the negative slope. At the low-volume extreme, a notable isolated point near 3.5 billion likely represents a holiday-shortened or anomalous trading session and sits at a mid-range GBP/USD value (~1.54), consistent with the overall mean but not with the regression trend. The Y-axis range is remarkably compressed (1.43–1.64, a spread of only ~0.21), meaning that visually small vertical differences represent economically meaningful currency moves. There is no obvious non-linear curvature, though the high-volume tail's downward pull suggests heteroscedasticity may be present.
Confounding Factors and Caveats
This correlation almost certainly reflects shared macroeconomic drivers rather than a direct mechanistic link. In 2010, both U.S. equity volume and GBP/USD were simultaneously influenced by post-financial-crisis risk sentiment, Federal Reserve and Bank of England policy divergence, European sovereign debt fears, and episodic events like the May 2010 "Flash Crash" — which would have dramatically spiked volume while potentially moving sterling. High-volume days in U.S. equities often coincide with risk-off episodes, during which investors may also flee to the dollar, suppressing GBP/USD — a classic spurious correlation mediated by a third variable (risk appetite). The dataset's single-year scope (2010) also limits generalizability, as this was an unusually volatile post-crisis period unlikely to represent a stable structural relationship.
Actionable Insights and Further Investigation
Practitioners should be cautious about using equity volume as a GBP/USD predictor given the near-zero Granger causality result — this relationship does not hold temporally in a way useful for trading signals. However, several follow-up analyses would be valuable: (1) incorporate a risk sentiment proxy (e.g., VIX) as a mediating variable to test whether it absorbs the correlation; (2) segment the data by market regime (calm vs. stress periods) to see if the correlation strengthens during risk-off episodes; (3) extend the analysis across multiple years to assess whether the 2010 relationship is period-specific; and (4) examine whether extreme volume days (top decile) drive the relationship disproportionately, as the outlier cluster suggests. The 18.7% explained variance, while modest, is non-trivial for forex modeling and warrants inclusion in a broader multivariate framework rather than dismissal.
X dataset: Cboe U.S. Equities Historical Market Volume Data 2010
Y dataset: FRED – GBP/USD Daily Exchange Rate
Part of experiment: Daily - Cboe U.S. Equities Historical Market Volume Data 2010 vs FRED – GBP/USD Daily Exchange Rate