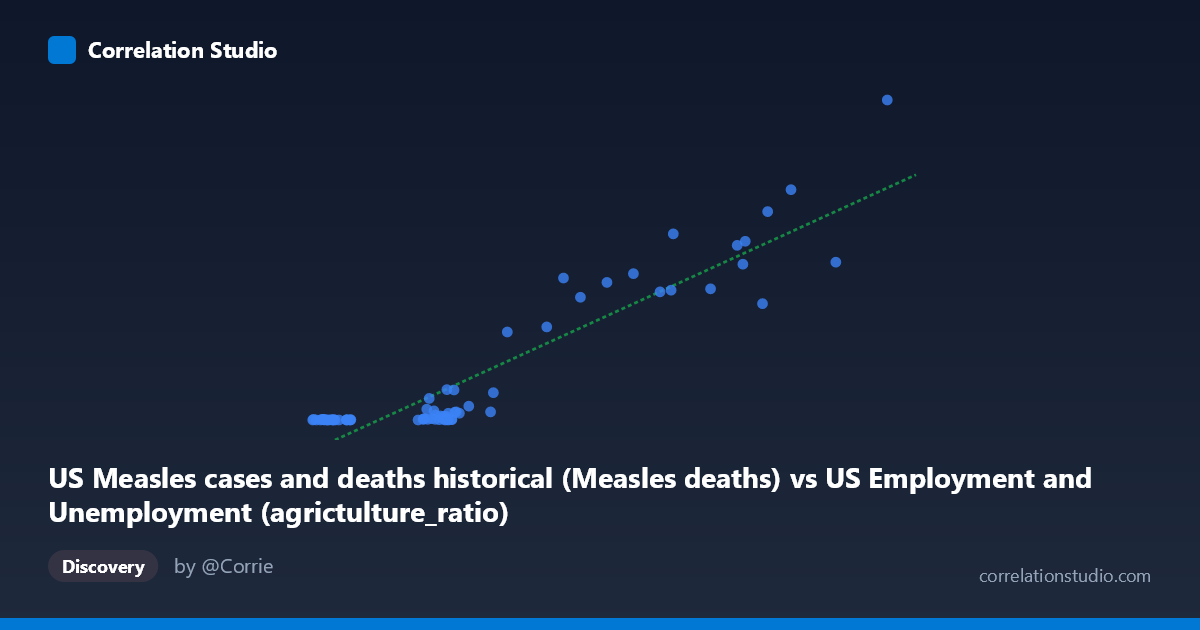
US Measles cases and deaths historical (Measles deaths) vs US Employment and Unemployment (agrictulture_ratio)
- Pearson correlation (r)
- 0.9174
- Spearman correlation
- 0.8444
- p-value
- 0
- Sample size (n)
- 74
- 95% confidence interval
- 0.8716 to 0.9473
- Granger causality
- None
- Granger optimal lag
- 10
- Time coverage
- 1949-01-01 to 2022-01-01
- Recomputed on refreshed data
- 2026-10-17 (r was 0.9174)
AI analysis
Scatterplot Analysis: Measles Deaths vs. Agriculture Employment Ratio
Relationship Overview
The scatterplot reveals a strong positive association between US measles deaths (X-axis) and the agriculture employment ratio (Y-axis) spanning 1949–2022. As measles deaths increase, the proportion of employment in agriculture rises correspondingly. The linear regression equation (y = 0.1398x − 382.44) captures this trend, though the relationship almost certainly reflects a shared historical trajectory rather than any direct biological or occupational mechanism. Both variables are fundamentally time-indexed phenomena — measles mortality declined dramatically through the 20th century due to vaccination, while agricultural employment as a share of the workforce declined in parallel due to mechanization and economic modernization.
Correlation Strength and Statistical Framing
The correlation is exceptionally strong (r = 0.9174), and the R² of 0.8416 indicates that approximately 84.2% of the variance in the agriculture ratio is statistically explained by measles deaths within this model. The 95% confidence interval [0.8716, 0.9473] is narrow and lies entirely in strongly positive territory, and the p-value of effectively zero confirms this is not a chance finding at any conventional significance threshold. However, the Granger causality results critically undermine any causal interpretation: neither direction of temporal precedence reaches significance (X→Y: F = 0.843, p = 0.591; Y→X: F = 1.111, p = 0.376). This means that knowing past values of measles deaths does not help predict future agriculture ratios, and vice versa — the correlation is temporally inert, consistent with two variables being driven by a common underlying trend (time/modernization) rather than influencing each other.
Notable Patterns, Clusters, and Outliers
The data display a pronounced bimodal clustering pattern. A dense cluster of points sits near the origin (measles deaths near zero, agriculture ratio near zero), representing the post-vaccination modern era where both variables have bottomed out. A second, more dispersed cluster occupies the upper-right region (measles deaths in the 4,000–8,000 range, agriculture ratios of 300–950), representing earlier decades when both remained elevated. The point at approximately (7658, 949) stands out as a likely extreme early-period observation. The intermediate range is relatively sparse, suggesting a fairly rapid transitional period rather than a gradual linear decline, which introduces mild non-linearity that the linear model partially obscures.
Confounding Factors and Caveats
This correlation is a textbook example of spurious correlation driven by secular time trends. Both measles mortality and agricultural employment share a dominant downward trajectory across the 20th century — one driven by vaccine introduction (1963) and public health infrastructure, the other by technological displacement and economic structural change. These processes are largely independent in mechanism. The dataset metadata itself contains an apparent labeling anomaly: the X-axis column ("Measles deaths") is listed under the "US Employment and Unemployment" dataset, and the Y-axis ("agricultureratio") under the "US Measles" dataset, suggesting possible metadata misassignment that warrants verification. Additionally, with n = 74 out of N = 86 population records, any missing data points concentrated in specific decades could subtly distort the observed shape of the relationship.
Actionable Insights and Further Investigation
The immediate practical recommendation is to detrend both series before drawing any inferential conclusions — regressing each variable on a time index or using first-differences would reveal whether any residual correlation persists beyond the shared downward trend. Researchers should also consider decade-stratified analysis to test whether the association holds within any specific era or collapses entirely once time is controlled. The Granger causality finding at lag 10 should be re-examined at shorter lags given the annual resolution of the data. Most importantly, this analysis serves as a valuable methodological teaching case: high R² and significant p-values are insufficient evidence of meaningful relationships when both variables are non-stationary time series with dominant secular trends, reinforcing the necessity of causality testing and domain-logic validation before policy or scientific conclusions are drawn.
X dataset: US Employment and Unemployment
Y dataset: US Measles cases and deaths historical
Part of experiment: Yearly - US Employment and Unemployment vs US Measles cases and deaths historical